
High School Recruit Data Metrics Explained for Athletes
Discover high school recruit data metrics explained. Learn how to assess athletic potential and make smarter college recruitment choices.

DepthChartIQ
Athletic Intelligence

High School Recruit Data Metrics Explained for Athletes

High school recruit data metrics measure athletic potential and recruitment value by combining evaluation scores, star ratings, and rankings drawn from performance, measurables, and coach assessments. Understanding these numbers is the first step toward making a realistic college choice. The NCAA reports that only 8.1% of male high school football players advance to any level of NCAA competition. That number puts the entire recruiting process in sharp focus. Athletes and parents who understand recruit data explained through real benchmarks make smarter decisions about which programs to target and how to present themselves.
1. What are the key recruit data metrics for high school athletes?
Recruit data metrics are the standardized tools evaluators use to rank and compare high school athletes across the country. They fall into three main categories: evaluation scores, star ratings, and national or regional rankings. Each one measures something slightly different, and together they form the picture a college coach sees before ever watching a single play.

Evaluation scores reflect projected college impact. Scouts assign numerical scores based on measurables like height, weight, speed, and position-specific skills. A football wide receiver, for example, is measured against benchmarks like a 4.4–4.6 40-yard dash time. Scores are not pass/fail grades. They are projections of how an athlete might develop at the next level.
Star ratings use a pyramid structure that most athletes and parents misread. The breakdown looks like this:
- 5-star: Represents 0.2–0.5% of any recruiting class, reserved for generational prospects
- 4-star: Roughly 12–15% of rated athletes, indicating high Division I potential
- 3-star: Around 40% of rated athletes, the most common tier for Division I prospects
- 2-star and below: The majority of rated athletes, typically targeting Division II, III, or NAIA programs
Rankings combine evaluation scores with coach opinions, game film review, and competition level. A player who posts elite measurables at a small rural school may rank lower than a player with similar numbers who competed against top-tier opponents. Context matters as much as the raw number.
2. How recruiting metrics connect to real college opportunities
Recruiting metrics open doors. They do not guarantee anything beyond initial attention. Quantitative metrics like exit velocity or 40-yard dash times attract a coach’s first look, but coaches ultimately prioritize in-game production and long-term projectability. A great number on paper means nothing if it does not hold up in competition.
The advancement statistics make this reality concrete. Only about 1.3% of high school football seniors receive an FBS scholarship offer. That is not a reason to quit. It is a reason to target the right level of program from the start.
| Metric | What it measures | Advancement context |
|---|---|---|
| 40-yard dash time | Raw speed and acceleration | Benchmark for football skill positions |
| Exit velocity | Bat speed and power potential | Key initial filter in baseball recruiting |
| Star rating | Overall projected college impact | 5-star: top 0.5% nationally |
| Evaluation score | Position-specific skill projection | Compared against verified program benchmarks |
| National ranking | Relative standing among peers | Influenced by competition level and game film |
Scholarship math adds another layer of complexity. Transfers now consume roughly 58% of FBS scholarships, which directly reduces the number of spots available to incoming high school recruits. Fewer open slots mean metrics need to be stronger, or the target school tier needs to be adjusted.
Pro Tip: Match your metrics against the verified roster averages of your target schools, not just the school’s national reputation. A 3-star athlete targeting a mid-major program with matching benchmarks has a far better shot than the same athlete chasing a Power Five program where the roster average is a full tier higher.
3. What are the biggest misconceptions about recruit data metrics?
The most damaging misconception is that a high star rating equals a scholarship offer. Star ratings are subjective projections, not contracts. They reflect a scout’s opinion of long-term potential, not a school’s commitment to recruit you. Ratings for underclassmen are intentionally conservative and change frequently as athletes develop and face stronger competition.
The second major trap is what recruiting analysts call the “dashboard trap.” Tracking too many data points without actionable insight creates noise, not clarity. Parents often fall into this pattern, monitoring dozens of metrics across multiple platforms without connecting any of them to a concrete next step.
Here are the most common misconceptions athletes and parents carry into the process:
- Metrics are guarantees. A 4-star rating does not mean four schools will offer. It means four schools might look.
- More data equals better decisions. Focusing on a small, consistent set of key metrics tied to real outcomes outperforms tracking everything available.
- Recruiting services deliver offers. Fewer than 4% of paying football families receive NCAA scholarship offers that can be directly linked to a recruiting service’s involvement. Advertised “commit rates” typically count any athlete who signed anywhere, regardless of the service’s actual role.
- Ratings are permanent. Ratings update regularly. A sophomore rated as a 3-star can move up or down based on junior-year performance and competition.
- Academics don’t affect athletic metrics. Coaches factor academic eligibility and GPA into recruiting decisions. A strong academic and athletic profile expands the pool of programs willing to offer.
Pro Tip: Ask any recruiting service for audited placement data, not just their headline commit rate. The difference between “athletes who signed” and “athletes who received scholarship offers influenced by our platform” is enormous.
4. How to use recruit data metrics to build a real recruiting strategy
The most effective recruiting strategy starts with honest self-assessment. Pull your current metrics, compare them to verified roster benchmarks at target schools, and build your list from there. Emotion and school reputation should not drive the initial list. Data should.
Follow these steps to build a data-driven recruiting approach:
-
Identify your three to five core metrics. For football, that might be 40-yard dash, position-specific strength numbers, and GPA. For baseball, exit velocity, fielding percentage, and academic standing. Pick the metrics coaches at your target level actually use.
-
Research verified benchmarks. FBS offensive linemen average 6’4" and 305 lbs. If you are 6’1" and 255 lbs as a junior, FBS is not your realistic target right now. That is not failure. That is data telling you where to focus.
-
Build a target list of 30–50 programs. Spread the list across three tiers: reach programs where your metrics are slightly below average, match programs where your numbers align with current roster data, and safety programs where your metrics exceed the average. A program comparison guide helps structure this process.
-
Create a verified recruiting profile. Include measurables, academic data, game film links, and coach contact information. Unverified claims get ignored. Documented numbers get responses.
-
Track your metrics over time. Recruiting is not a one-time snapshot. Coaches want to see development. A player whose 40-yard dash drops from 4.7 to 4.55 between sophomore and junior year tells a story of growth that a static number never could.
-
Factor in the transfer portal. With transfers consuming a large share of available scholarships, the program selection decision matters more than ever. A school with high roster turnover may offer more playing time opportunity than a program with a stable, veteran roster.
-
Revisit your list every six months. Metrics change. Rosters change. A school that was a reach in your sophomore year may become a realistic match by the fall of your junior year.
Key Takeaways
Recruiting metrics are tools for targeting the right programs, not guarantees of offers, and athletes who match their data to verified school benchmarks make better decisions than those chasing reputation alone.
| Point | Details |
|---|---|
| Metrics open doors, not offers | High scores attract attention; in-game performance and academics close the deal. |
| Star ratings are projections | Ratings reflect long-term potential and update frequently as athletes develop. |
| Scholarship slots are limited | Transfers consume roughly 58% of FBS scholarships, shrinking the pool for high school recruits. |
| Avoid the dashboard trap | Track three to five core metrics tied to real outcomes rather than monitoring every available data point. |
| Target 30–50 programs by data fit | Spread targets across reach, match, and safety tiers using verified roster benchmarks. |
What I’ve learned from watching families misread recruiting data
Most parents I’ve seen go through this process make the same mistake. They treat a star rating like a college acceptance letter. Their athlete gets rated a 4-star as a sophomore, and suddenly the family is only talking to Power Five programs. By junior year, when the offers don’t materialize, the panic sets in.
The athletes who navigate this well are the ones who treat their metrics as a starting point, not a destination. They check their numbers against real roster data at real schools. They understand that recruiting data is a foot in the door, not a guaranteed seat at the table. They also know that a 3-star rating at a school where you will actually play beats a 4-star rating at a school where you will sit on the bench for three years.
The other thing I’d push back on is the idea that more data equals more clarity. It doesn’t. I’ve watched families pay for multiple recruiting platforms, track 20 different metrics, and still have no idea which schools to call. The families who do best pick a small core set of numbers, understand what those numbers mean at their target level, and then go make film and compete. Data informs the strategy. It does not replace the work.
— John
DepthchartIQ gives athletes a data edge in recruiting
Knowing your metrics is one thing. Knowing how those metrics translate into actual playing time at specific programs is another level entirely.
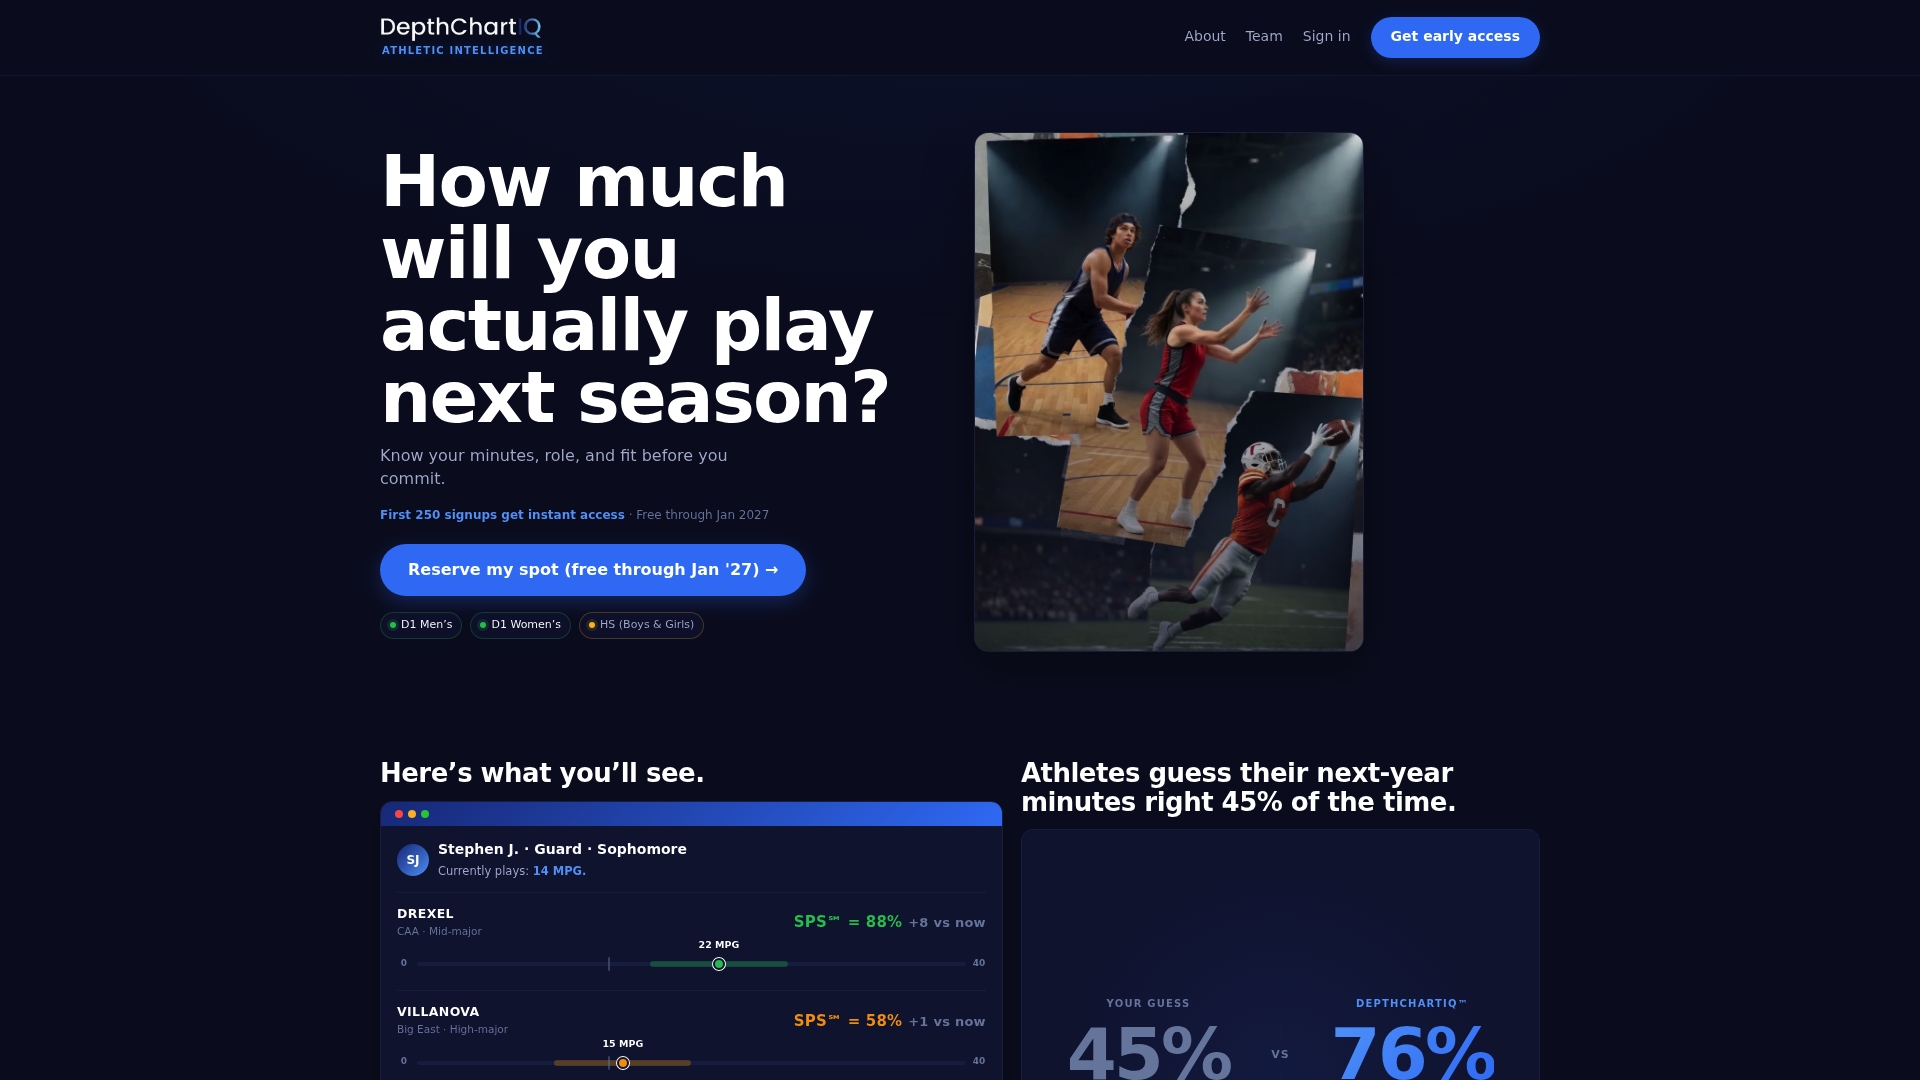
DepthchartIQ uses advanced prediction algorithms and real-time roster data to give high school recruits a clear picture of where they fit. The platform’s Success Probability Scores show athletes which programs offer the most realistic path to playing time, based on current roster composition and projected changes. With a 76% accuracy rate in predicting player outcomes, DepthchartIQ goes beyond star ratings and gives athletes the context those ratings can never provide. For athletes and parents who want to evaluate programs with real data, it is the clearest tool available.
FAQ
What are recruit data metrics for high school athletes?
Recruit data metrics are standardized scores, star ratings, and rankings that evaluate an athlete’s potential college impact. They combine measurables like speed and size with coach assessments and competition level.
How accurate are star ratings in predicting college success?
Star ratings reflect projected potential, not guaranteed outcomes. They update frequently as athletes develop, and ratings are subjective projections that change based on performance against stronger competition.
What percentage of high school athletes receive Division I scholarships?
Only about 1–1.2% of high school football players reach NCAA Division I, and transfers consume roughly 58% of FBS scholarships, leaving very few spots for incoming recruits each year.
How many programs should an athlete target during recruiting?
Targeting 30–50 programs spread across reach, match, and safety tiers gives athletes the best coverage. Use verified roster benchmarks, not school reputation, to build that list.
Do recruiting services improve scholarship offer rates?
Audited data shows fewer than 4% of paying football families receive scholarship offers directly linked to a recruiting service. Advertised commit rates typically count any athlete who signed anywhere, not just those the service placed.