
Roster Age vs. Minutes in College Basketball: How to Read It
Does an older roster mean fewer minutes for you? Learn how to read roster age, class year and returning minutes before you transfer, stay or commit.
 DepthChartIQUpdated 13 min read
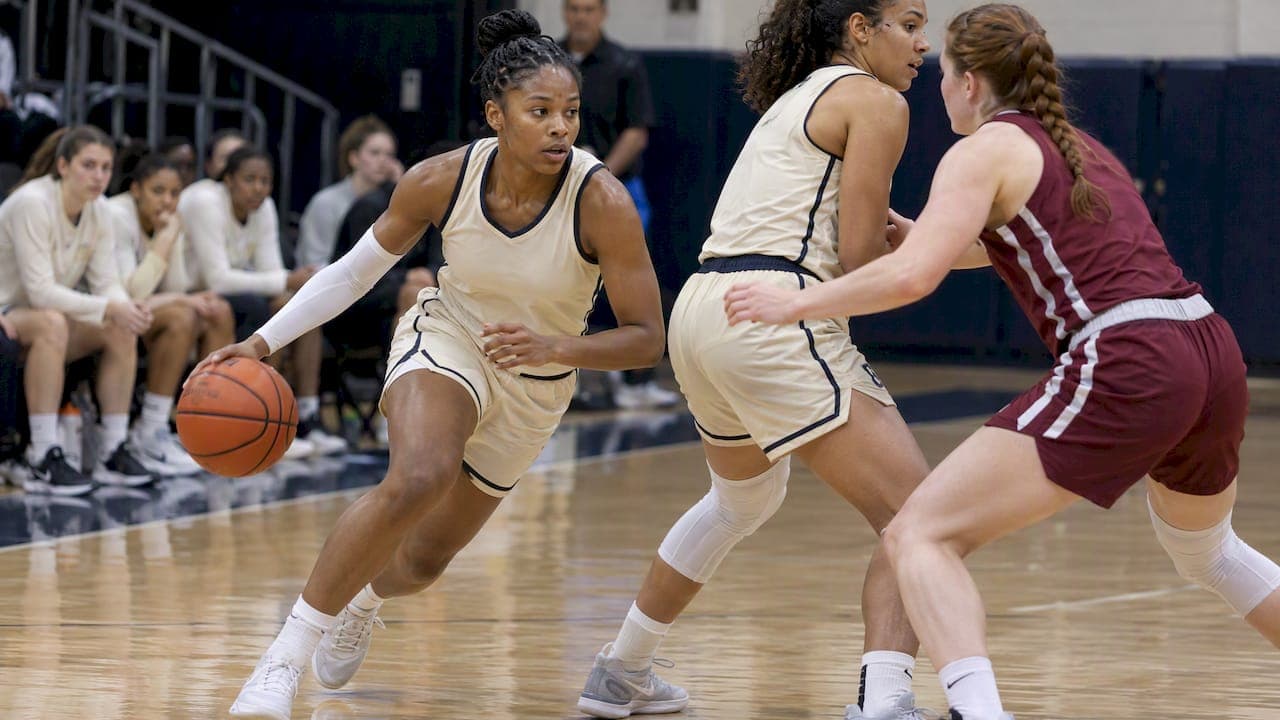

A older roster does not automatically close the door on playing time, and a young one does not guarantee it. Age tells you how much experience a coach has to choose from. Minutes tell you who he or she actually chose. To judge your own chances, you need both numbers, and you need them at your position.
This guide is for players weighing a transfer, athletes deciding whether to stay, incoming recruits, and the parents helping them. It explains what roster age measures, what the public research says about experience and minutes, and how to turn a roster page into a realistic read on your role.
TL;DR
- Roster age measures experience on a team. It does not measure how many minutes are open for you.
- Winning teams tend to lean on returning players for a large share of minutes, so a veteran-heavy roster at your position is a real hurdle.
- Compare age, class year and returning minutes together, then look only at the players who share your position.
- Projections shift as rosters change, and a young player can still earn heavy minutes. Treat any number as a range.
- DepthChartIQ gives you a projected minutes-per-game range, a Success Probability Score and a Roster Pressure Score for each program you are considering.
Table of Contents
- What “roster age vs. minutes” actually compares
- What the research says about experience and winning
- Returning minutes matter more than average age
- Age, class year and experience are not the same thing
- How to read a roster for your own minutes
- What transferring has meant for minutes
- The limits of roster age as a predictor
- How parents can use this
- Perspective
- Put a range on your own situation
- FAQ
- Sources
What “roster age vs. minutes” actually compares
People use the phrase for two different things, and mixing them up leads to bad decisions.
Roster age is a team-level number. Analysts often weight it by minutes, so a senior who plays 30 a night counts more than a sophomore who plays four. One well-known approach is the Age Index described by NCAA.com: multiply each player’s minutes per game by years of experience, total the results, and adjust to a 200-minute team average. A team with a high number is experienced where it counts, on the floor.
Minutes are the outcome for an individual. Your role next season depends on who is ahead of you, who is arriving, and how a coach plans to use the rotation.
So when a roster looks “old,” the useful question is not “are they old?” It is “how many of those older players play my position, and how many minutes will they take?”
What the research says about experience and winning
Experience is closely tied to success at the top of the sport, and that shapes how coaches build rotations.
- NCAA.com’s look at 34 Final Four teams from 2010 to 2018 found an average Age Index of 518.5, equivalent to five players averaging 2.6 years of experience.
- ESPN’s preseason look at the 2023-24 season found that eleven teams in the top 25 projected an average age weighted by minutes of 22.0 or older.
- The 2023 Final Four was the first since 1998 in which no true freshman started a game for any participating team.
- As of November 2025, Gonzaga’s roster averaged 21.2 years of age, with its key rotation players expected to average 22 by the 2026 NCAA Tournament.
What this means for you: at programs that win, the rotation tends to belong to players who have been in the system. If you are a freshman or a new transfer, you are competing with that group.
Why older rosters are common now
Two changes pushed rosters older. The CBS Sports report on the 2023 Final Four points to the extra year of eligibility granted because of the pandemic and the chance to earn income through NIL as reasons players stay longer. The same article quotes San Diego State coach Brian Dutcher on how the transfer portal and immediate eligibility let programs keep older, more experienced rosters.
For an athlete, the portal cuts both ways. Programs can add a veteran at your position in the spring, which changes the picture after you have already signed or committed. That is one reason we pay so much attention to roster pressure, covered below.
Returning minutes matter more than average age
Average age is a blunt tool. A roster can average 21 years old because it has five seniors and eight freshmen, or because everyone is a junior. Those are very different places to look for minutes.
A better lens is the share of minutes returning from last season. Evan Miyakawa’s roster-construction work suggests that returning players should account for at least 50% of total playing time. His follow-up on mid-majors found that teams in March Madness from 2021 to 2025 relied on returning players for over 64% of their minutes, about 10% higher than teams that missed the tournament.

That has a plain implication. If a program you are considering returns most of its minutes, the open minutes are few, and coaches who build that way are likely to keep doing it. If a program lost a lot of minutes, there is room, but also a question about whether the coaching staff is filling it with a transfer.
Ken Pomeroy has argued that continuity is highly valuable in a vacuum, while noting that good roster building means finding talent that is both elite and likely to stay for several years. Translated for a recruit: coaches value a player who can be good for multiple seasons, so a younger player with a clear path can be a priority too.
Age, class year and experience are not the same thing
These three terms get used interchangeably on roster pages. They should not be.
| Measure | What it tells you | What it misses |
|---|---|---|
| Age | How old a player is today | A 22-year-old redshirt may have little college game time |
| Class year | Years of eligibility used or remaining | Extra eligibility years and transfers blur the label |
| Experience (minutes played) | How much a player has actually played | It may have come at a different level or role |
Class year is the shortcut most families use, and it can mislead. A “graduate student” might be a seven-minute-a-game reserve, or the leading scorer. A sophomore might have started 30 games at a previous school.
There is also a relative-age wrinkle. A study on the relative age effect in NCAA Division I athletes notes that redshirting can delay an athlete and make a late-born athlete relatively older than the cohort. Age on a roster page can therefore reflect timing, not production.
How to read a roster for your own minutes
Use this process for each school on your list. It takes about 15 minutes per program.
- List your position group. Count every player who plays your spot, or could. Positionless lineups blur this, so include players who share your skill set, such as ball handlers or rim protectors.
- Note class year and last season’s minutes for each. Who played the most? Who is leaving? Who is returning?
- Find the minutes that left. The biggest openings come from graduating or departing players at your position, not from the roster’s average age.
- Check incoming players. Look for signed recruits and portal commitments at your position. A new class can fill the gap you were counting on. Our guide for incoming recruits checking their projected impact walks through this.
- Look at the coach’s habits. Does the staff play freshmen early, or does it wait? Does it add a transfer every spring at your position?
- Be honest about your own level. Compare your production and measurables to the players currently in your slot, not to the school’s brand.
- Ask a direct question. In a conversation with a coach, ask where you fit in the rotation and what happened to the last player who held your role.
When you finish, you should have a rough range for your minutes, not a single number. Rosters change after the portal closes, so revisit the list.
Watch the bubble
Players ranked ninth through twelfth on a roster are the ones whose minutes swing the most. If your realistic outcome is a spot on that edge, read our breakdown of roster bubble players and how minutes swing from year to year.
What transferring has meant for minutes
Many players move because they want more playing time, and some research supports the idea that it can work. A 2021 study of Division I men’s basketball transfers found that they averaged significantly more games and minutes after transferring. That is an average, and it says nothing about your specific destination. A transfer into a crowded position group at a deep team can go the other way.
A few rules shape the timing:
- Division I men’s basketball uses a short spring transfer window. In 2026 it ran from April 7 to April 21. Check the NCAA’s transfer windows page for the current dates before you plan.
- Four-year transfers to Division I can generally seek immediate eligibility if they leave academically eligible, are in good standing and meet progress-toward-degree requirements. Your compliance office or the school you are joining should confirm your case.
- Recruiting contact is governed by contact, quiet, evaluation and dead periods, which define when coaches can make in-person assessments or contact.
- The NCAA has warned against so-called ghost transfers. Reported memos threatened fines for schools and a suspension of 50% of the season for head coaches who violate the rule. Do not agree to any arrangement that involves a school roster move you cannot explain.
For more on timing and eligibility, see our post on the one-time transfer rule.
The limits of roster age as a predictor
Roster age is a useful starting point and a poor final answer. ESPN’s own age analysis cautions that projections may change as rosters shift, and previously underrated first-year players may earn heavy minutes. Age is not everything.
Other factors move minutes more than age does:
- Talent and fit. A coach plays the best five for the system. If you are better at your spot, you will play.
- Injuries and eligibility changes. One injury to a starter reshuffles the whole rotation.
- Late roster moves. A transfer commitment in May can change a position group you studied in April.
- Schedule and postseason. Opponent strength can change how a coach distributes minutes. See how tougher schedules can change playing time and what postseason minutes look like.
A sensible approach is to treat age as one input among several and to think in ranges. A freshman at a veteran-heavy school may land at 5 to 15 minutes a game, depending on how the roster turns over. That range is more useful than a promise from a recruiting pitch.
How parents can use this
If you are a parent, you probably hear two stories: the coach’s pitch, and your child’s hopes. Roster age and minutes data give you a third, neutral one.
Try these questions at home:
- Who plays my child’s position now, and how old are they?
- How many of those minutes return next season?
- Has this program added a transfer at that position in the last two years?
- If my child does not play as a freshman, is there a visible path in year two or three?
- Does the level fit? Some high school athletes decide that a program at a different level offers a clearer role and better development.
Write the answers down for every school. Differences between programs show up quickly.
Perspective
We built DepthChartIQ around a simple observation: most athletes make transfer and commitment decisions on gut feel and a coach’s pitch. A coach’s pitch is a promise about the future. A roster page is a list of names. Neither tells you how crowded your position will be or what range of minutes is realistic.
Roster age is a good example. It sounds like the answer, but an old roster can have an open spot at your position, and a young one can be packed with talented players ahead of you. What athletes need is a read at the program level, for their own profile.
That is why, for each program you are considering, we show a projected minutes-per-game range for next season, a Success Probability Score (the chance of gaining minutes) and a Roster Pressure Score (how crowded your position is at that school). We also show best-fit programs. These are estimates with ranges, not guarantees, and they are meant to give you something concrete to weigh next to the conversation you have with a coach.
We are building for athletes and their families, not for coaching staffs. That shapes everything we do.
Put a range on your own situation
DepthChartIQ is built for college basketball players and their families deciding whether to transfer, stay or commit. Enter your profile, and for each program on your list you will see a projected minutes-per-game range, a Success Probability Score and a Roster Pressure Score, along with best-fit programs. It covers college transfers, athletes deciding whether to stay, and incoming high school and junior college players. It is free during Early Access, and DepthChartIQ Pro follows after that.

See your projected minutes on DepthChartIQ. If you want help researching schools and drafting messages to coaches, Spotter, our assistant for athletes, is available now.
FAQ
Do older players always get more minutes than younger ones?
No. Experienced players tend to dominate the rotations of winning teams, but talent, position and fit decide each role. Reports on recent Final Fours show how rare freshman starters have become, yet underrated first-year players can still earn heavy minutes when a roster has a hole.
What is a good returning-minutes percentage to look for?
It depends on what you want. Research from Evan Miyakawa suggests successful teams return at least half their minutes, and NCAA tournament teams have averaged over 64%. If you are trying to find an open role, a lower returning share at your position means more room, though a coach may fill it with a transfer.
Should I transfer if my team’s roster is getting older?
Not on age alone. Check how many older players share your position, how many minutes they will take, and whether younger players are being recruited at your spot. Some studies show transfers average more minutes after moving, but that depends on the destination. Talk to your current staff and compliance office before entering the portal.
How should a high school recruit compare programs?
Compare each school’s position group, class years and minutes returning, and ask what the coach’s plan for your first two seasons is. Then weigh scholarship level, development and academics. A projected minutes range for each program can help you compare them side by side.
Sources
- The lesson learned from 34 Final Four teams: Experience matters (NCAA.com)
- The average age in men’s college basketball in 2023-24 (ESPN)
- How Gonzaga’s age, experience can give them an edge (The Spokesman-Review)
- 2023 March Madness: Why no true freshman is starting for a team in the Final Four (CBS Sports)
- Did math figure out the best way to build a modern college basketball roster? (Extra Points)
- Mid-Major Roster Construction Strategies (Evan Miyakawa)
- KenPom: Experience is important, but roster continuity is the key to success (The Athletic)
- Time out or fast break? The relative age effect in NCAA Division 1 athletes
- Switching Schools: Examining the Networks, Antecedents, and Consequences of Transfers (study)
- NCAA Division I Notification of Transfer Windows
- NCAA Guide for Four-Year Transfers
- Compliance for Coaches (UC San Diego Athletics)
- What Rick Barnes said about Jalen Washington joining Tennessee (Yahoo Sports)