
Lineup Churn Forecast for College Players: Transfer or Stay?
Use minutes ranges, success probability, roster pressure, NCAA transfer timing, and turnover research to weigh whether to transfer or stay in college...
 DepthChartIQUpdated 9 min read

A lineup churn forecast estimates how much a roster is likely to change and what that change means for your playing time next season. For a player weighing a transfer, it turns guesswork about minutes into a projected range and a probability you can actually plan around. Tools like DepthChartIQ build these forecasts from projected minutes, a Success Probability Score, and a Roster Pressure Score for each program you’re considering.
TL;DR:
- Compare the full minutes range, since a 12 to 22 minute projection may reflect uncertainty about incoming recruits or coaching changes.
- Treat low or medium Success Probability and high Roster Pressure as warning signs, and refresh forecasts after coaching changes or major portal moves.
- The proposed Division I notification windows are April 6 to 20 for women and April 7 to 21 for men, pending approval.
- Start researching and contacting target programs before the proposed windows open; early 2026 portal activity involved hundreds of entrants and fast commitments.
- Set a personal minutes threshold, weigh it against academic fit, and verify eligibility deadlines with both schools before committing.
Table of Contents
- What goes into a forecast and why roster turnover matters
- How to read your forecast numbers before deciding
- Transfer windows and timing that drive churn
- Turning a forecast into a transfer or stay decision
- Your next steps once you have a forecast
- DepthChartIQ: see your forecast before you commit
- FAQ
- Sources
What goes into a forecast and why roster turnover matters
A useful forecast breaks a vague question (will I play?) into three concrete pieces.
- Projected minutes-per-game range: a band, not a single number, that reflects realistic upside and downside for a specific roster.
- Success Probability Score: an estimate of how likely you are to gain meaningful minutes at that program.
- Roster Pressure Score: how crowded your position is, based on returning players, incoming signees, and depth at your spot.
These components matter because roster turnover has a measurable relationship with how teams perform, not just with who sits on the bench. An observational study of NCAA Division I men’s basketball covering the 2021 to 2022 through 2024 to 2025 seasons found that higher roster turnover is associated with reduced average point margin per game, even when the departures involved were modest. Teams that lose more minutes and production to departures tend to see their scoring margins slip, according to the Synapse study, which is a signal worth weighing alongside your own playing time odds.
That turnover is not theoretical. Early days of the 2026 transfer portal cycle showed hundreds of entrants and fast movement across every level of the sport, according to CBS Sports tracking, underscoring how quickly a roster you’re evaluating today can look different in a few weeks. Our breakdown of transfer portal myths covers more on how timing shapes these numbers.
How to read your forecast numbers before deciding
Forecast numbers only help if you know what they’re actually telling you.
- Start with the minutes range, not just the midpoint. A projected range of 12 to 22 minutes tells you more than a single number: the width shows how much your role depends on factors still in motion, like incoming signees or a coaching change.
- Treat Success Probability as a risk gauge. A high score suggests a clearer path to minutes; a low or medium score means your role is more contingent on things outside your control, so you should weigh that uncertainty against how badly you need playing time now.
- Use Roster Pressure to spot immediate competition. High pressure at your position signals more bodies competing for the same minutes, which also means more volatility if someone else transfers in or out.
Pro Tip: Compare the width of your minutes range across two programs, not just the midpoints: a narrower range usually means a more settled depth chart.
Picture two guards looking at different offers. One sees a 20 to 28 minute range with high Success Probability and low Roster Pressure: a fairly settled path. The other sees an 8 to 18 minute range with medium probability and high pressure at guard: a bigger bet with more variables still in play. Neither number is a guarantee, but each gives you a clearer basis for comparison than a coach’s pitch alone. Our guide on minutes volatility in college basketball walks through more scenarios like this.

Transfer windows and timing that drive churn
Timing concentrates churn into short windows, which changes how fast you need to move.
- The Division I Basketball Oversight Committees have proposed 15-day notification-of-transfer windows starting after the Final Fours: April 6 to 20 for women and April 7 to 21 for men, a change from the previous 30-day windows after the second round, pending Division I Cabinet approval.
- Coaching changes are a common trigger for roster churn, since a new staff often reshapes rotations and recruiting priorities almost immediately.
- Shorter, later windows mean less time to gather information, visit campuses, and compare offers, so contingency plans and faster outreach matter more than in past cycles.
If these shorter windows are approved, waiting until the window opens to start researching programs puts you behind. Start building your target list and reviewing forecasts well before the window begins, so you’re ready to act the moment it does.
Turning a forecast into a transfer or stay decision
A forecast is most useful when you weigh it against what actually matters to you.
- Rank your priorities first. Minutes, role, academics, NIL opportunity, and proximity to home carry different weight for every player, so decide what you’re actually optimizing for before you look at any numbers.
- Map each program’s forecast to those priorities. A program with a strong minutes range but a weak academic fit might rank lower than one with a smaller range but everything else you want.
- Set your own threshold, not someone else’s. If a 15 minute floor is your baseline for considering a program, treat anything below that as a signal to look elsewhere, understanding this is your own guidance rather than a fixed rule.
- Watch team-level churn signals. Incoming recruits, other departures, and coaching staff changes can shift a program’s Roster Pressure Score before you even enroll.
Pro Tip: Revisit a program’s forecast after any coaching change or major portal news; Roster Pressure can shift fast once a roster starts moving.
Treat the forecast as one input, not the whole decision. Pair it with direct conversations with coaches and, where possible, a campus visit, since neither a number nor a recruiting pitch alone captures the full picture. Our framework on weighing the expected value of transferring walks through how to balance these inputs side by side.
Your next steps once you have a forecast
Once you have numbers in hand, move through them in order.
- Update your athlete profile with current stats and list three target programs to compare directly.
- Rank those programs using their minutes ranges, Success Probability, and Roster Pressure scores, then schedule outreach and visits with the top candidates.
- Confirm compliance paperwork and eligibility deadlines with your current and prospective programs well before any transfer window closes.
- Draft a short outreach message to coaches that states your fit for their system and your availability, keeping it specific rather than generic.
Players on the roster bubble often move fastest once they have a clear number to act on rather than a vague sense of “maybe.” Our guide for roster bubble players has more on turning that clarity into action. Keep in mind that broader recruiting analysis, including partner coverage of transfer portal effects on programs and athletes, points to the same conclusion: players who move early with a plan tend to have more options than those who wait.
DepthChartIQ: see your forecast before you commit
We built DepthChartIQ to give you the forecast inputs described above for any program you’re considering, without having to rely on a coach’s pitch or secondhand portal chatter. For each school on your list, you get a projected minutes-per-game range, a Success Probability Score, a Roster Pressure Score, and a list of best-fit programs based on your profile.
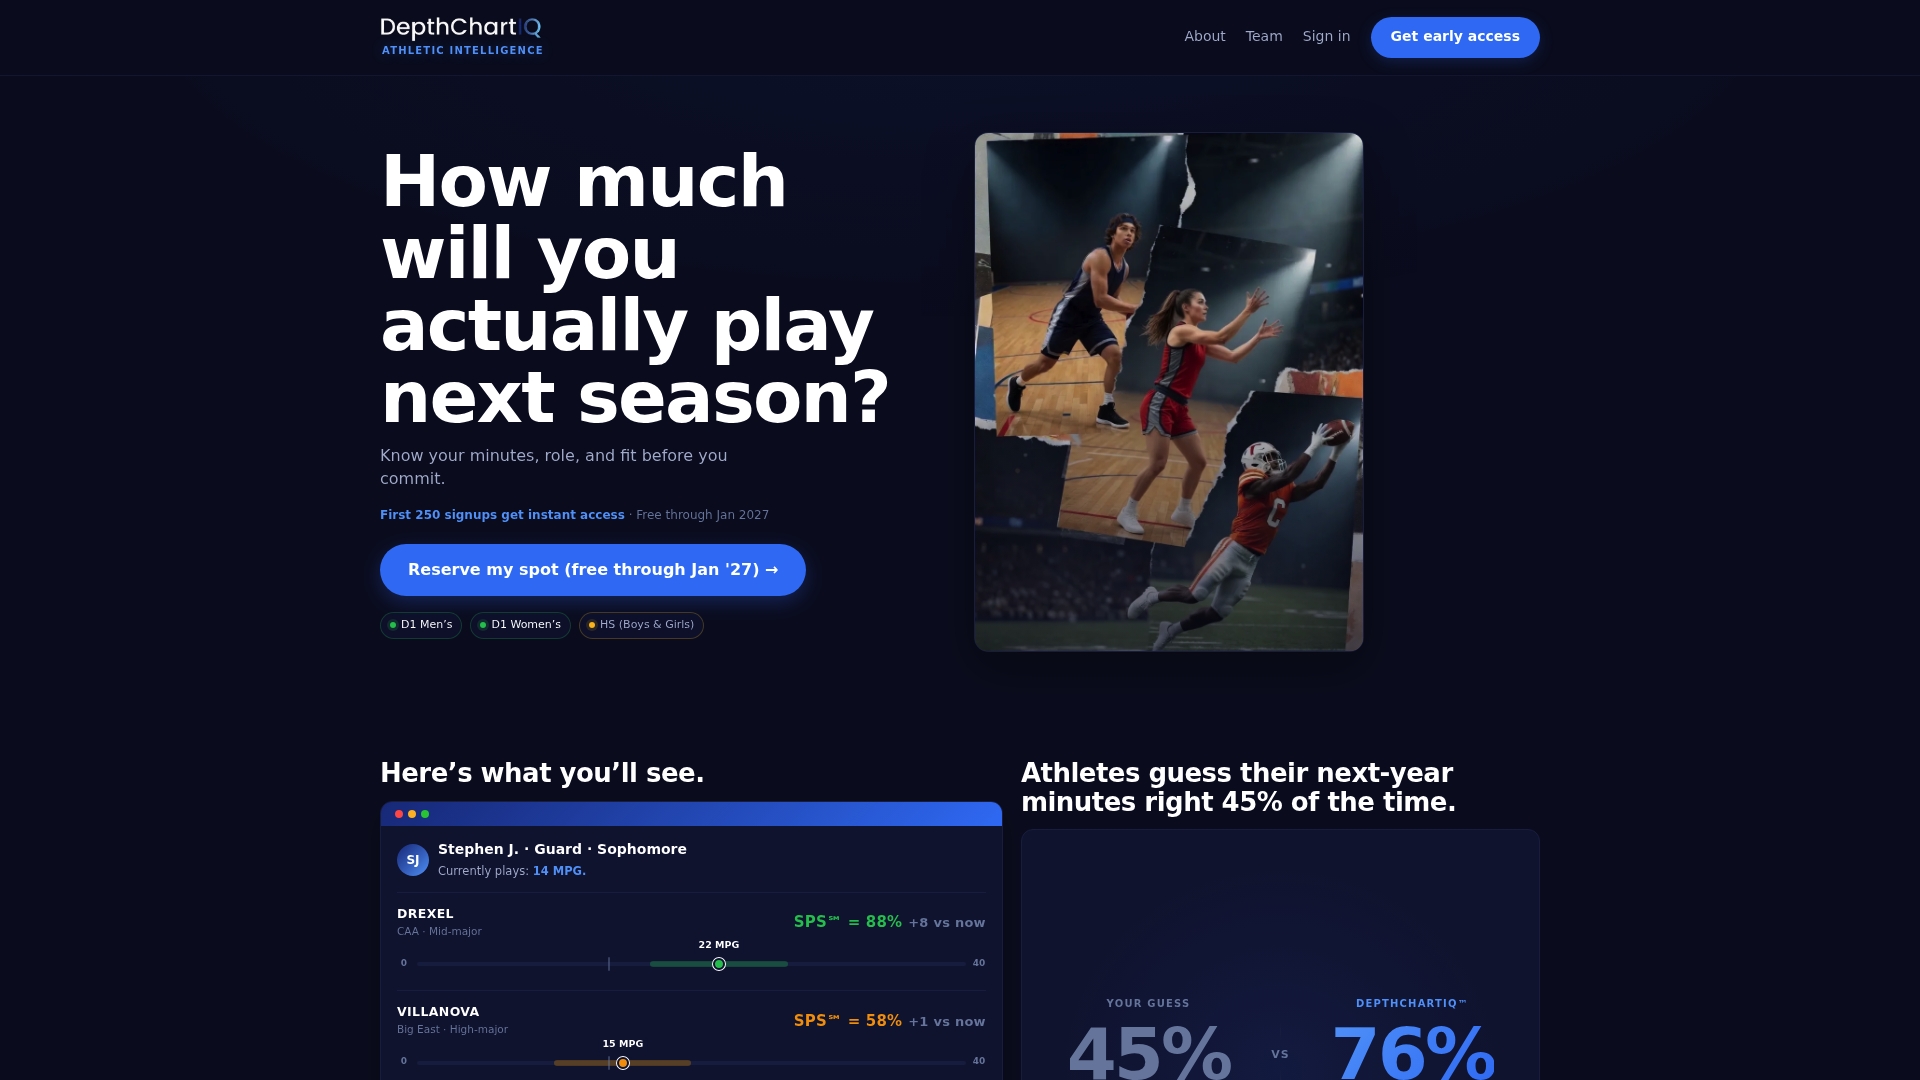
- Projected minutes-per-game range for each program you’re evaluating
- Success Probability Score showing your likelihood of earning minutes
- Roster Pressure Score showing how crowded your position is at that school
- Best-fit program suggestions based on your athlete profile
We’re free during Early Access through December 31, 2026, with DepthChartIQ Pro available afterward for athletes who want to stay on top of forecasts long term. Build your profile, pull forecasts for programs like Maryland-Baltimore County or Kansas City, and run them through the action checklist above before you make your next move.
FAQ
What exactly does a lineup churn forecast measure?
A lineup churn forecast estimates how much a team’s roster and rotation are likely to change, and what that shift means for an individual player’s projected minutes. It typically combines a minutes range, a probability of earning playing time, and a measure of positional competition rather than a single prediction.
Does roster turnover actually hurt team performance?
An observational study of Division I men’s basketball from 2021 to 2022 through 2024 to 2025 found that higher roster turnover is associated with reduced scoring margins, even with modest departures. That does not mean every team with turnover struggles, but it is a factor worth weighing when evaluating a program in transition.
When do transfer decisions need to happen?
Timing depends on the notification window your sport uses; the Division I committees have proposed 15-day windows after the Final Fours, April 6 to 20 for women and April 7 to 21 for men, pending NCAA approval. Because the window may be shorter than in past years, starting your research and outreach before it opens gives you more time to compare options.
How crowded does the portal get once it opens?
Early days of the 2026 cycle produced hundreds of entrants and fast-moving commitments across every level of college basketball, according to CBS Sports tracking. That pace is a reason to have a prioritized list of target programs ready before the window opens rather than reacting in real time.
How much does DepthChartIQ cost?
DepthChartIQ is free during Early Access through December 31, 2026. After that period, DepthChartIQ Pro is available for athletes who want continued access to program forecasts.