
College Basketball Opportunity Index: 5 Checks to Stay or Transfer
Compare projected minutes, success probability, and roster pressure to weigh whether to stay, transfer, or commit to a college basketball program.
 DepthChartIQUpdated 8 min read

An opportunity index is a program-level playing-time ranking that combines a projected minutes range, a Success Probability Score, and a Roster Pressure Score to help players and families decide whether to transfer, commit, or stay. It turns a vague sense of “will I play?” into three specific signals you can compare across schools. None of these numbers are a promise, but together they give you a clearer starting point than a coach’s pitch alone.
TL;DR:
- A wide minutes range can signal an unsettled rotation; a narrow range with a high Success Probability Score suggests the coach has defined your role.
- Compare the Success Probability Score with Roster Pressure: a high score and low pressure signal the clearest opening, while high pressure means competition remains.
- Coach evaluation remains the main driver of playing time; physical testing correlations were inconsistent at mid majors, so confirm projections directly with staff.
- For high major rotation fit, applied scouting cites a BPM near 3.0 as a practical baseline, while transfers usually supplement high school recruiting.
- Recheck projections near your decision deadline, because portal departures, injuries, and recruiting changes can alter roster opportunities within days or weeks.
Table of Contents
- What an opportunity index actually measures
- How to use an opportunity index: a step-by-step decision checklist
- How to read the numbers without misreading them
- What the research says about playing-time drivers and why that matters
- Using DepthChartIQ to run opportunity-index comparisons
- FAQ
- Sources
What an opportunity index actually measures
Three components make up a typical opportunity index, and each answers a different question about your fit at a program.
A projected minutes-per-game range gives you a realistic band, not a single number, because playing time depends on injuries, lineup changes, and coaching decisions that shift throughout a season. A range of 12 to 20 minutes tells you more than a flat “15 minutes” estimate because it reflects how much uncertainty actually exists at that roster spot.
A Success Probability Score estimates your chance of actually earning rotation minutes at that specific program, factoring in your role, the current depth chart, and how your skill set lines up with the team’s needs. A high score at a mid-major and a low score at a high-major for the same player is common and reflects real differences in roster depth, not inconsistency in the metric.
A Roster Pressure Score measures how crowded your position is once you count returning players, incoming recruits, and committed transfers. Here is how the components typically interact:
- A wide-open point guard spot at a rebuilding mid-major often produces low roster pressure and a higher Success Probability Score.
- A talent-stacked wing rotation at a high-major program usually produces high roster pressure even for a skilled transfer.
- A position group losing multiple seniors can flip from high pressure to low pressure within a single offseason.
How to use an opportunity index: a step-by-step decision checklist
Running the numbers only helps if you follow a consistent process. Use this sequence when comparing programs:
- Define the role you actually need. Decide whether you are chasing a starting job, a steady rotation spot, or simply development minutes as a freshman or redshirt candidate.
- Match the projected minutes range to your timeline. A wide range with a longer runway fits a player with eligibility to spare; a narrow range matters more if you need minutes immediately.
- Read Success Probability and Roster Pressure together. A high Success Probability Score paired with low Roster Pressure is the strongest combination; a high score paired with high pressure usually means the opportunity is real but contested.
- Weigh coach evaluation and system fit alongside the numbers. A coach’s evaluation of your skills still carries enormous weight in who actually plays, so treat the index as one input next to direct conversations with the staff.
- Move on timing. Once you shortlist programs, contact coaches directly, ask pointed questions about position battles, and watch transfer portal timing windows so you are not comparing stale roster information.
Pro Tip: Ask a coach directly how your projected role compares to the players currently ahead of you at your position, not just whether there is “an opportunity.”
How to read the numbers without misreading them
Certain metric combinations show up again and again, and learning to recognize them prevents common mistakes. A wide minutes range often signals that a coaching staff has not settled a rotation, which can cut either way for an incoming player. A narrow range paired with a high Success Probability Score usually means a coach has a defined role already in mind for you, which is a more predictable situation than a wide-open battle.
A few patterns to watch for:
- Wide range plus low Success Probability Score: a crowded, unsettled position where even a strong fit faces real competition.
- Narrow range plus high Success Probability Score: a defined role that a coach has already mapped out for you.
- Low projected minutes plus high probability: a bench role that is nearly guaranteed but capped in scope.
Coach evaluation explains most of the variance in college playing time, with physical testing and playing experience adding only a smaller additional portion, according to research from Ariel University. That gap matters when you are tempted to treat any single metric as the final word. Portal churn can also move these numbers quickly: a sudden departure can open a narrow range into a wide one within days, so treat the index as a snapshot that deserves a recheck closer to your decision deadline.
What the research says about playing-time drivers and why that matters

Coach evaluation remains the dominant factor behind who plays, which is the central finding of the Ariel University study on athletic performance tests and playing time. That same research found that physical test correlations with playing time were inconsistent at the mid-major level, meaning basketball skill and a coach’s read on a player can outweigh combine-style numbers in many programs.
Applied scouting work points the same direction. Reporting from 247Sports on transfer portal roster construction recommends tempo-free and minutes-free metrics for projecting transfer fit, with a BPM near 3.0 serving as a practical baseline for rotation-level players at high-major programs. The same reporting notes that most successful rosters are still built primarily through high school recruiting, with transfers added selectively rather than as wholesale rebuilds.
Coach evaluation explains the majority of playing-time variance in college basketball, while physical testing adds a smaller, secondary contribution.
The practical takeaway: treat an opportunity index as a strong starting point, then confirm it against direct conversations with coaching staffs before committing.
Using DepthChartIQ to run opportunity-index comparisons
Comparing programs side by side gets a lot easier when you can see the same three numbers for every school on your list. With DepthChartIQ, you build a profile once and then see, for each program you are considering, a projected minutes-per-game range, a Success Probability Score, and a Roster Pressure Score, along with a list of best-fit programs based on those inputs.
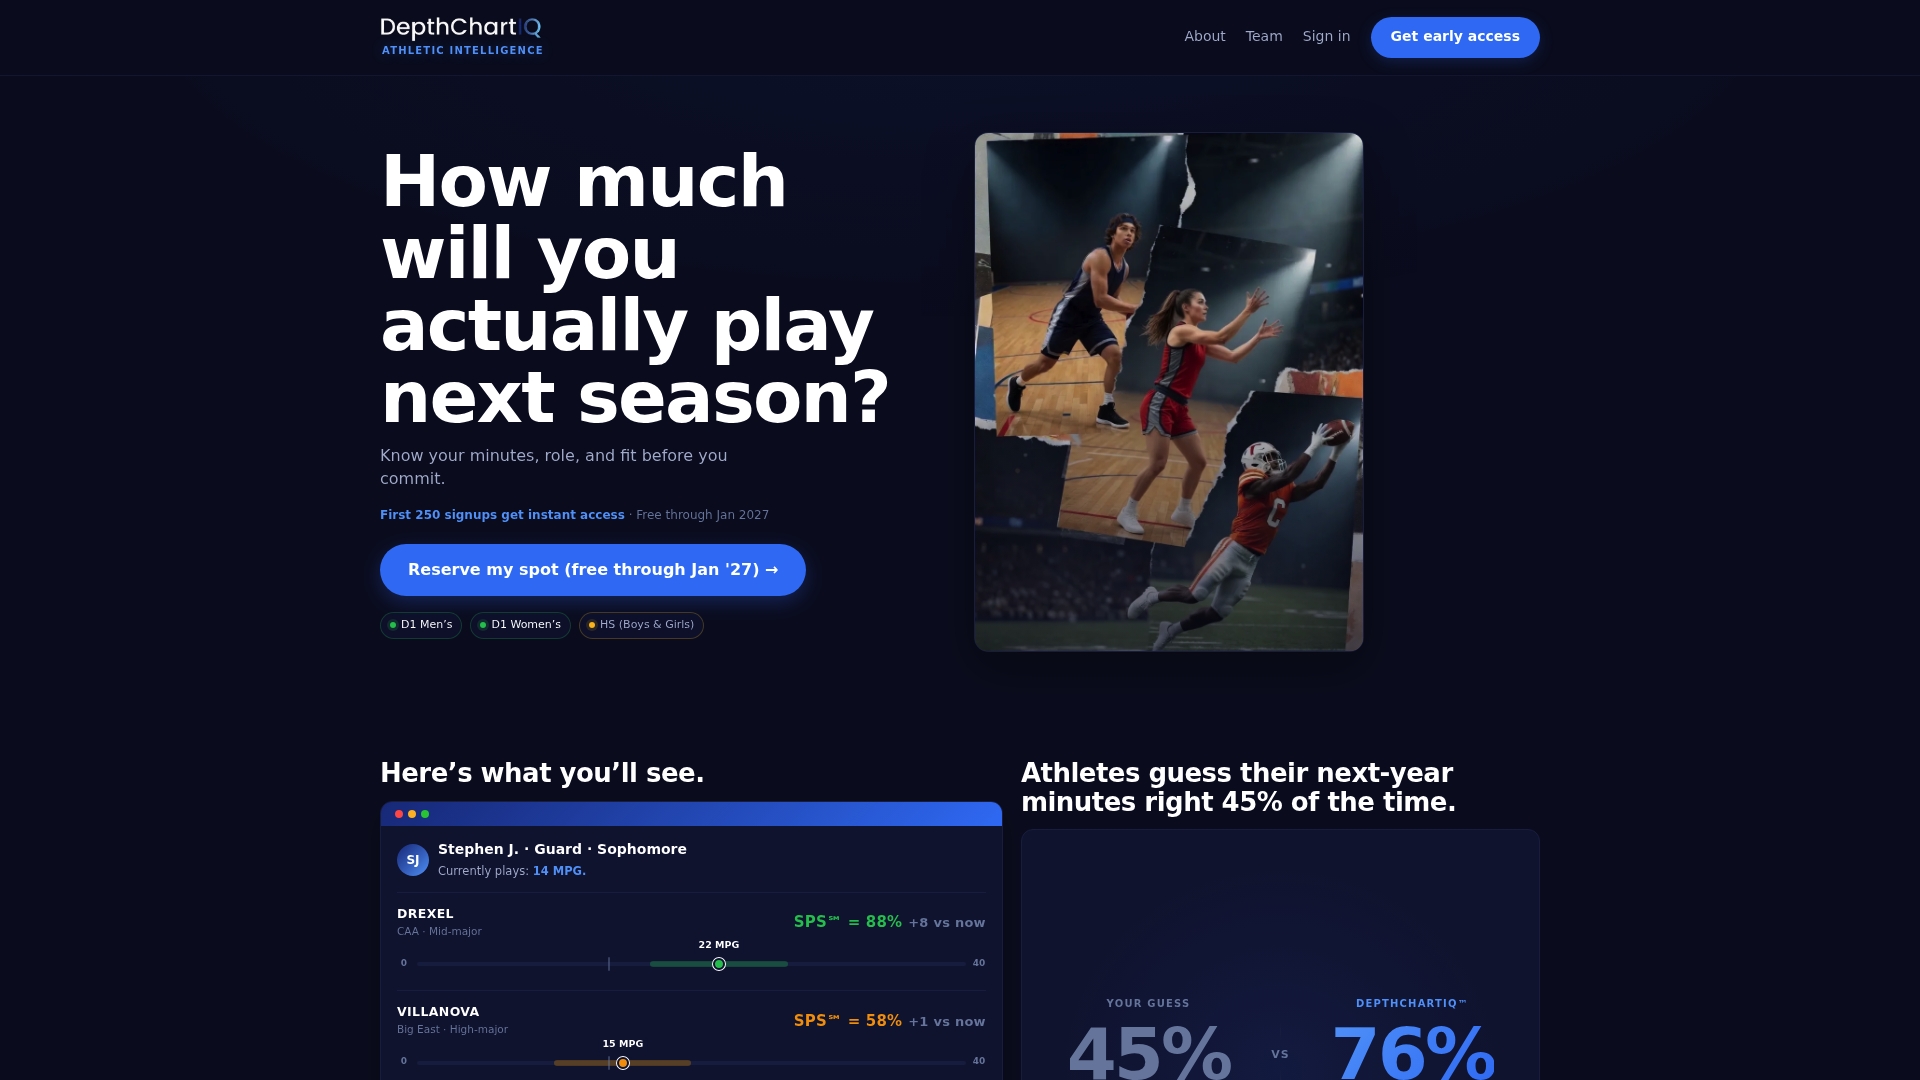
Say you are a guard weighing a move from a high-major bench role to two mid-major programs. Pulling up each school lets you compare:
- Which program shows a higher Success Probability Score given your position and skill set.
- Which roster carries less Roster Pressure at your position next season.
- Which projected minutes range actually fits the role you want, starter, rotation, or development.
Our platform is built for athletes and families making these calls, not for coaching staffs, and projections are presented as ranges and estimates rather than guarantees. Current pricing and access details are available on our website. Start building your profile and compare programs at DepthChartIQ.
FAQ
What does an opportunity index measure for a college basketball player?
An opportunity index measures your projected playing-time outlook at a specific program, typically combining a projected minutes-per-game range, a Success Probability Score, and a Roster Pressure Score. It is meant to be read as a decision input alongside coach conversations, not as a guaranteed outcome.
How accurate is a Success Probability Score?
A Success Probability Score estimates your likelihood of earning rotation minutes based on roster context and fit, but it remains an estimate rather than a certainty. Coach evaluation still plays a dominant role in who actually plays, so pair the score with direct outreach to coaching staffs.
Do opportunity indexes work differently for men’s and women’s basketball?
The same three core signals, projected minutes range, Success Probability Score, and Roster Pressure Score, apply to both men’s and women’s Division I programs, though the underlying roster dynamics differ by team. Roster pressure depends on each program’s specific mix of returners, incoming recruits, and transfers, which varies regardless of division or gender.
How quickly can playing-time opportunity change after a transfer decision?
Playing-time opportunity can shift within weeks if a program adds a transfer, loses a player to injury, or finalizes its incoming recruiting class. That is why it helps to recheck an opportunity index close to your actual decision deadline rather than relying on numbers from months earlier.
What is a common mistake when reading an opportunity index?
A common mistake is chasing the single highest projected minutes number while ignoring a low Success Probability Score tied to it. A moderate-to-high Success Probability Score paired with a realistic minutes range for your timeline tends to produce a better outcome than an optimistic projection with weak odds behind it.
Sources
- Relationship between Athletic Performance Tests and Playing Time in Elite College Basketball Players - Ariel University
- Transfer Portal Preview: Researching Sweet 16 Rosters — 247Sports / Peegs
- Relationship between athletic performance tests and playing time in elite college basketball players — PMC