
Player Development Benchmarks for College Basketball
Explore key player development benchmarks in college basketball to evaluate skills, guide recruiting, and make informed career decisions.

DepthChartIQ
Athletic Intelligence
Player Development Benchmarks for College Basketball
Player development benchmarks in college basketball are defined as measurable standards of physical ability, skill execution, and statistical performance used to evaluate athlete progress across NCAA divisions. These benchmarks matter to athletes, parents, and coaches because they create an objective language for growth, one that cuts through subjective impressions and guides decisions on recruiting, roster building, and transfers. With 48% of NCAA Division I men’s basketball players in recent draft cohorts estimated to reach professional opportunities, the stakes behind tracking development correctly are real. Understanding where a player stands against position-specific standards is the first step toward making informed career decisions.
1. Key physical benchmarks for college basketball players by position
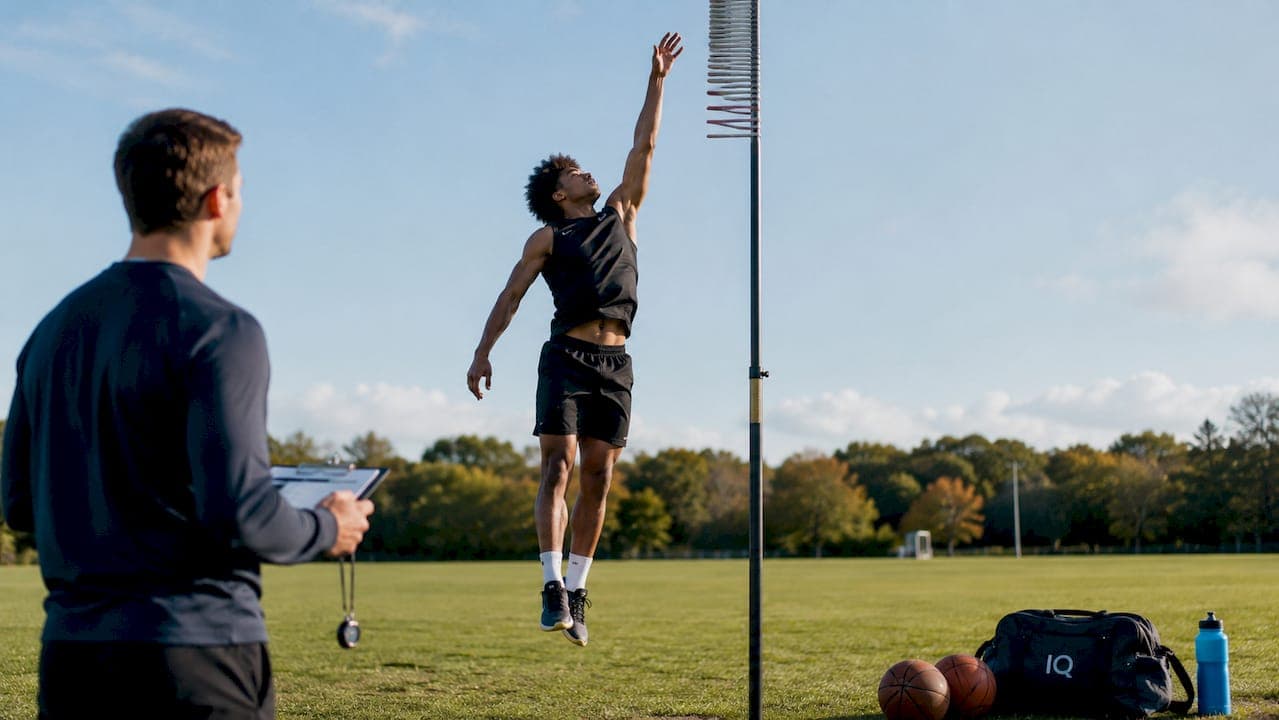
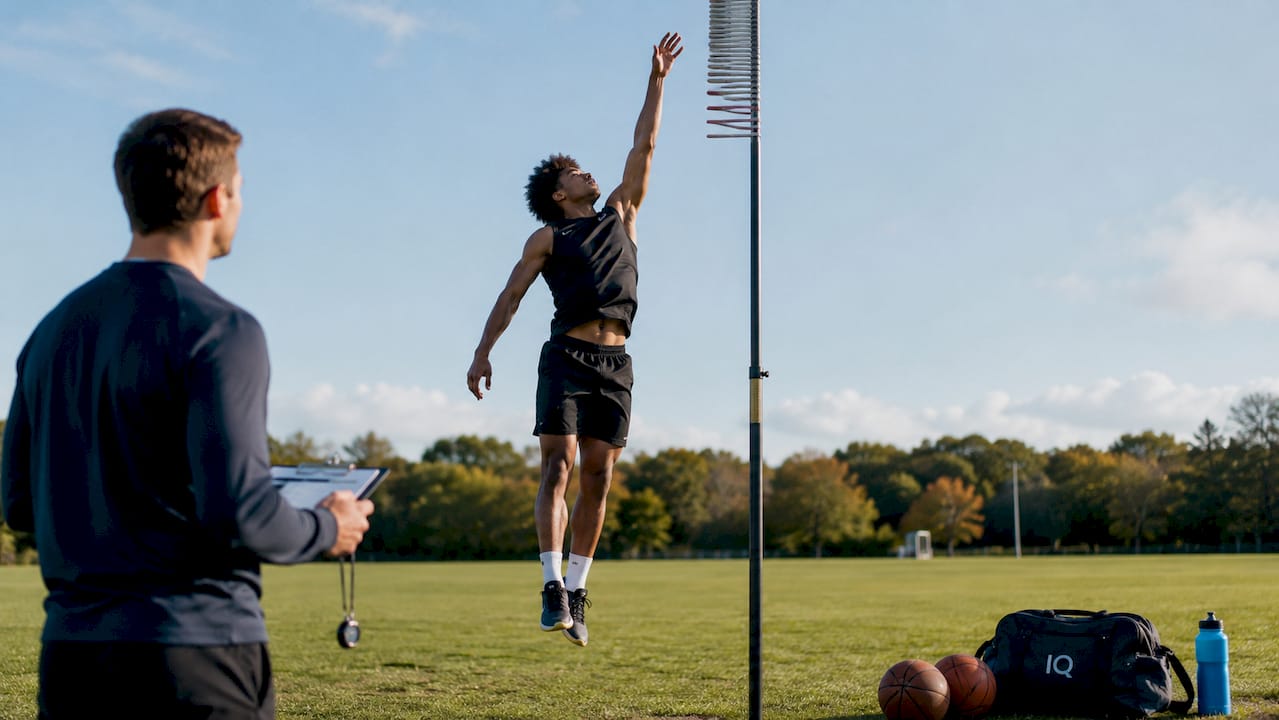
Physical measurables are the foundation of recruiting evaluation in college basketball. Height, wingspan, vertical leap, and lane agility are the primary physical benchmarks coaches use, and they vary significantly by position and division level. A point guard at a Power 4 program typically falls in the 6’1" to 6’5" range, while high-level D1 players are expected to post vertical leaps above 30 inches and lane agility times under 10.8 seconds. These numbers are not arbitrary. They reflect the physical demands of playing at speed against elite competition.
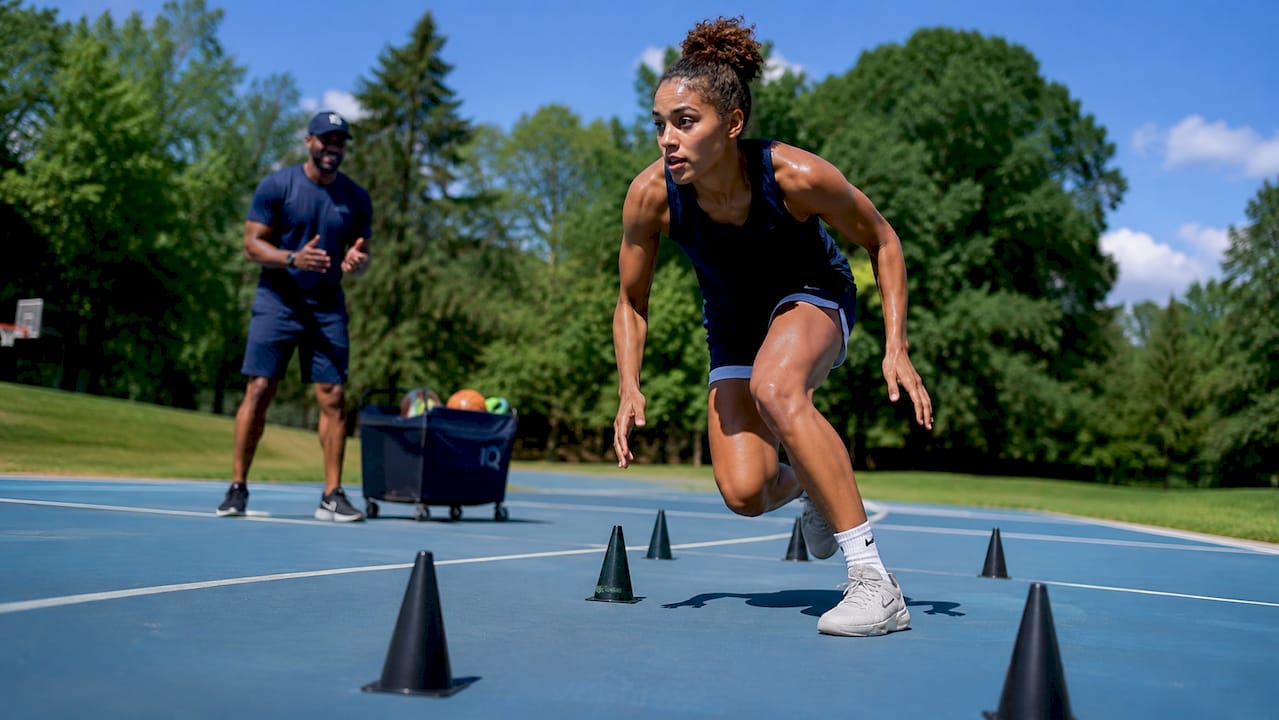
Sprint speed and lane agility tests measure quickness in ways that height alone cannot. A wing who tests well in both areas signals the ability to guard multiple positions, which is increasingly valuable in modern basketball. Physical benchmarks also shift across divisions. D2 and D3 programs accept lower thresholds on most measurables, but the relative importance of each metric stays consistent.
Pro Tip: Wingspan is now weighted more heavily than height in many recruiting evaluations. A 6’4" guard with a 6’8" wingspan profiles as a versatile defender, which opens doors at higher levels.
| Position | Height Range (Power 4 D1) | Vertical Leap | Lane Agility |
|---|---|---|---|
| Point Guard | 6’1" – 6’5" | 30"+ | Under 10.8s |
| Wing / SG / SF | 6’4" – 6’8" | 32"+ | Under 11.0s |
| Big / PF / C | 6’7" – 6’11" | 28"+ | Under 11.5s |
2. Statistical performance benchmarks that indicate player growth
Raw points per game tell only a fraction of the development story. Coaches and analysts rely on tempo-free metrics like Offensive Rating (ORtg) and Defensive Rating (DRtg), True Shooting Percentage (TS%), usage rate, and assist-to-turnover ratio to evaluate whether a player is actually improving. These metrics remove the distortion caused by pace, role changes, and opponent quality. A player averaging 12 points per game on a slow-paced team may be outperforming a player averaging 16 on a fast-paced one.
Per-40-minute stats provide a fair comparison across players with different roles and playing time. Usage rate shows how often a player is involved in possessions, which gives context to efficiency numbers. A high TS% at a low usage rate is encouraging but incomplete. The real signal comes when efficiency holds up as usage increases, which is the clearest sign of genuine skill development.
Position-specific statistical benchmarks to track include:
- Point guards: Assist-to-turnover ratio above 2.0, usage rate between 18% and 25%
- Wings: TS% above 55%, defensive rebound rate above 12%
- Bigs: Offensive rebound rate above 8%, block rate above 3%, TS% above 58%
- All positions: Turnover rate below 15% signals reliable decision-making
Advanced analytics tools like KenPom and Barttorvik provide opponent-adjusted versions of these metrics, which are far more reliable than raw box score numbers for evaluating player growth.
3. How NCAA rules and practice limits shape development timelines
NCAA rules cap teams at 20 hours of countable athletic activity per week during the season, with only 8 hours total in the offseason and a maximum of 2 hours of on-court individual skill work. That is a tight window. Significant skill transformation does not happen inside those hours alone. It happens in the gym at 6 AM before anyone is watching.
This reality shifts the responsibility for benchmark progress squarely onto the athlete. Coaches can design systems and provide feedback, but the ceiling on their direct influence is structural. A 17-season study tracking nearly 29,000 player observations found that approximately 65% of Division I coaches show no statistically significant impact on individual player productivity over time. Recruitment quality, not coaching, drives most outcomes.
Elite programs address the time constraint by focusing on acceleration load per minute rather than total training volume. This approach maximizes high-intensity reps within limited hours, which produces better physical adaptation than simply logging more time on the court.
Pro Tip: Athletes and parents should treat independent training as non-negotiable. The 2-hour NCAA on-court limit applies to team-organized workouts. Personal skill sessions outside that structure are unrestricted and are where most measurable benchmark gains occur.
4. Using analytics to guide transfer and recruitment decisions
Transfer decisions made without analytics are guesses. KenPom and Barttorvik provide tempo-adjusted efficiency ratings, usage data, and opponent-strength splits that give a far clearer picture of a player’s actual performance level than conference averages alone. KenPom operates as a paid service with adjusted efficiency ratings, while Barttorvik offers free customizable filters with recency weighting. Both are standard tools for coaches evaluating portal candidates.
Opponent-strength splits are especially critical when evaluating transfers. A player who excels against weak competition but struggles against top-50 opponents is a different profile than their overall numbers suggest. Role projection matters equally. A player moving from a low-usage role to a high-usage role at a new program needs to show efficiency at higher usage rates before that projection holds up.
Turnover rate above 20% is a significant red flag for guards and typically worsens against tougher competition. Turnover habits are sticky. They reflect decision-making patterns that are difficult to change in a new environment under increased pressure.
Key analytic features to evaluate in transfer decisions:
- Adjusted efficiency ratings: Normalize performance for pace and opponent quality
- Usage rate trends: Show whether a player can handle a larger role
- Opponent-strength splits: Separate performance against top-50 vs. bottom-100 teams
- Turnover rate: Guards above 20% carry real risk in tougher conferences
- TS% by role: Efficiency must hold as shot volume and responsibility increase
Understanding how data informs athletic decisions is now a baseline skill for any athlete or parent navigating the transfer portal seriously.
5. Realistic development benchmarks over a four-year college career
A four-year college basketball career follows a predictable arc, but the rate of improvement varies widely based on recruiting level, position, coaching environment, and personal work ethic. Most players show the steepest statistical gains between their freshman and sophomore seasons, when system familiarity and physical maturity combine. After that, gains become more incremental and position-specific.
Performance tracking technologies now impact 86% of college basketball players moderately or significantly. That number reflects how deeply data has entered the development process at every level. Programs that track conditioning benchmarks like shuttle-run aerobic tests and sprint times create consistent monitoring loops that catch regression before it shows up in game stats.
Realistic year-over-year improvement targets for college players include:
- Year 1 to Year 2: TS% improvement of 3–5 points, assist-to-turnover ratio increase of 0.3–0.5
- Year 2 to Year 3: Usage rate increase of 2–4%, defensive rating improvement as role expands
- Year 3 to Year 4: Stabilization of efficiency at peak usage, leadership in conditioning benchmarks
- Physical development: Vertical leap gains of 2–4 inches are realistic with consistent strength training through sophomore year
Environmental familiarity plays a larger role than most athletes expect. Players who stay in the same system for two or more years show more consistent statistical growth than those who transfer frequently. That pattern holds even when the original program is at a lower level.
Coaches recommend tracking conditioning benchmarks consistently rather than fixating on single performance scores. Sprint times and shuttle-run results give a more reliable picture of physical readiness than any one game performance.
Pro Tip: Use your freshman year stats as a baseline, not a ceiling. The players who improve most dramatically between years one and three are almost always the ones who treated the offseason as their primary development window.
For athletes thinking beyond college, understanding post-college basketball pathways starts with knowing exactly where your benchmarks stand relative to professional thresholds.
6. Positionless basketball and evolving physical standards
Modern basketball has shifted the physical benchmarks that matter most. Centers who shoot above 33% from three and defend multiple positions are significantly more recruitable than traditional back-to-the-basket types. This shift changes how athletes should think about their own development priorities. A 6’9" forward who cannot shoot from the perimeter faces a narrower recruiting market than one who can.
Versatility now functions as a benchmark in itself. Coaches at the D1 level increasingly evaluate players on how many positions they can guard and how many offensive actions they can execute. A wing who can handle the ball in pick-and-roll, shoot off movement, and switch onto guards profiles as a higher-value recruit than a specialist at any one of those skills.
This evolution means athletes should track skill versatility alongside traditional physical measurables. The ability to defend multiple positions is not just a coaching preference. It is a measurable outcome that shows up in defensive rating data and opponent-strength splits. Athletes who compare program fit carefully before committing will find that programs running positionless systems demand different benchmarks than traditional ones.
Key Takeaways
Tracking the right benchmarks across physical, statistical, and conditioning categories gives athletes, parents, and coaches the clearest picture of real player development in college basketball.
| Point | Details |
|---|---|
| Physical benchmarks vary by position | Guards, wings, and bigs each have distinct height, wingspan, and agility thresholds across D1, D2, and D3. |
| Efficiency metrics outperform raw stats | TS%, usage rate, and opponent-adjusted ratings reveal true growth better than points per game. |
| NCAA limits shift development responsibility | With only 20 hours of team activity per week, independent training drives most measurable benchmark gains. |
| Turnover rate is a transfer red flag | Guards with turnover rates above 20% typically worsen against tougher competition in new programs. |
| Versatility is now a measurable standard | Centers and wings who defend multiple positions and shoot from the perimeter profile as higher-value recruits. |
What benchmarks actually tell you (and what they miss)
The most common mistake I see athletes and parents make is treating a single metric as a verdict. A player posts a 58% TS% and everyone assumes development is on track. But TS% at a 14% usage rate against weak competition is a very different number than the same percentage at 22% usage against a top-25 schedule. Context is not optional. It is the whole point.
What I have found after watching hundreds of development trajectories is that the athletes who improve most are not always the ones with the best raw benchmarks coming in. They are the ones who treat the gap between their current numbers and the standard as information rather than judgment. A 28-inch vertical is not a label. It is a starting point with a clear training prescription attached.
The data also cannot measure what happens between the ears. Intrinsic motivation, the kind that gets a player in the gym at 6 AM without a coach watching, is the variable that explains most of the outlier development stories. Benchmarks are the scoreboard. The athlete’s ownership of the process is what determines whether the score moves.
My honest recommendation: use analytics and physical standards as your map, but do not confuse the map for the territory. Film, personal evaluation, and honest conversations with coaches fill in what the numbers leave out. The athletes who combine all three consistently make better decisions about programs, transfers, and their own training priorities.
— John
DepthchartIQ: benchmark data built for your decisions
Knowing the benchmarks is one thing. Knowing where you stand against them in real time is another. DepthchartIQ gives athletes, parents, and coaches access to advanced metrics and prediction algorithms that translate raw performance data into clear, position-specific insights.
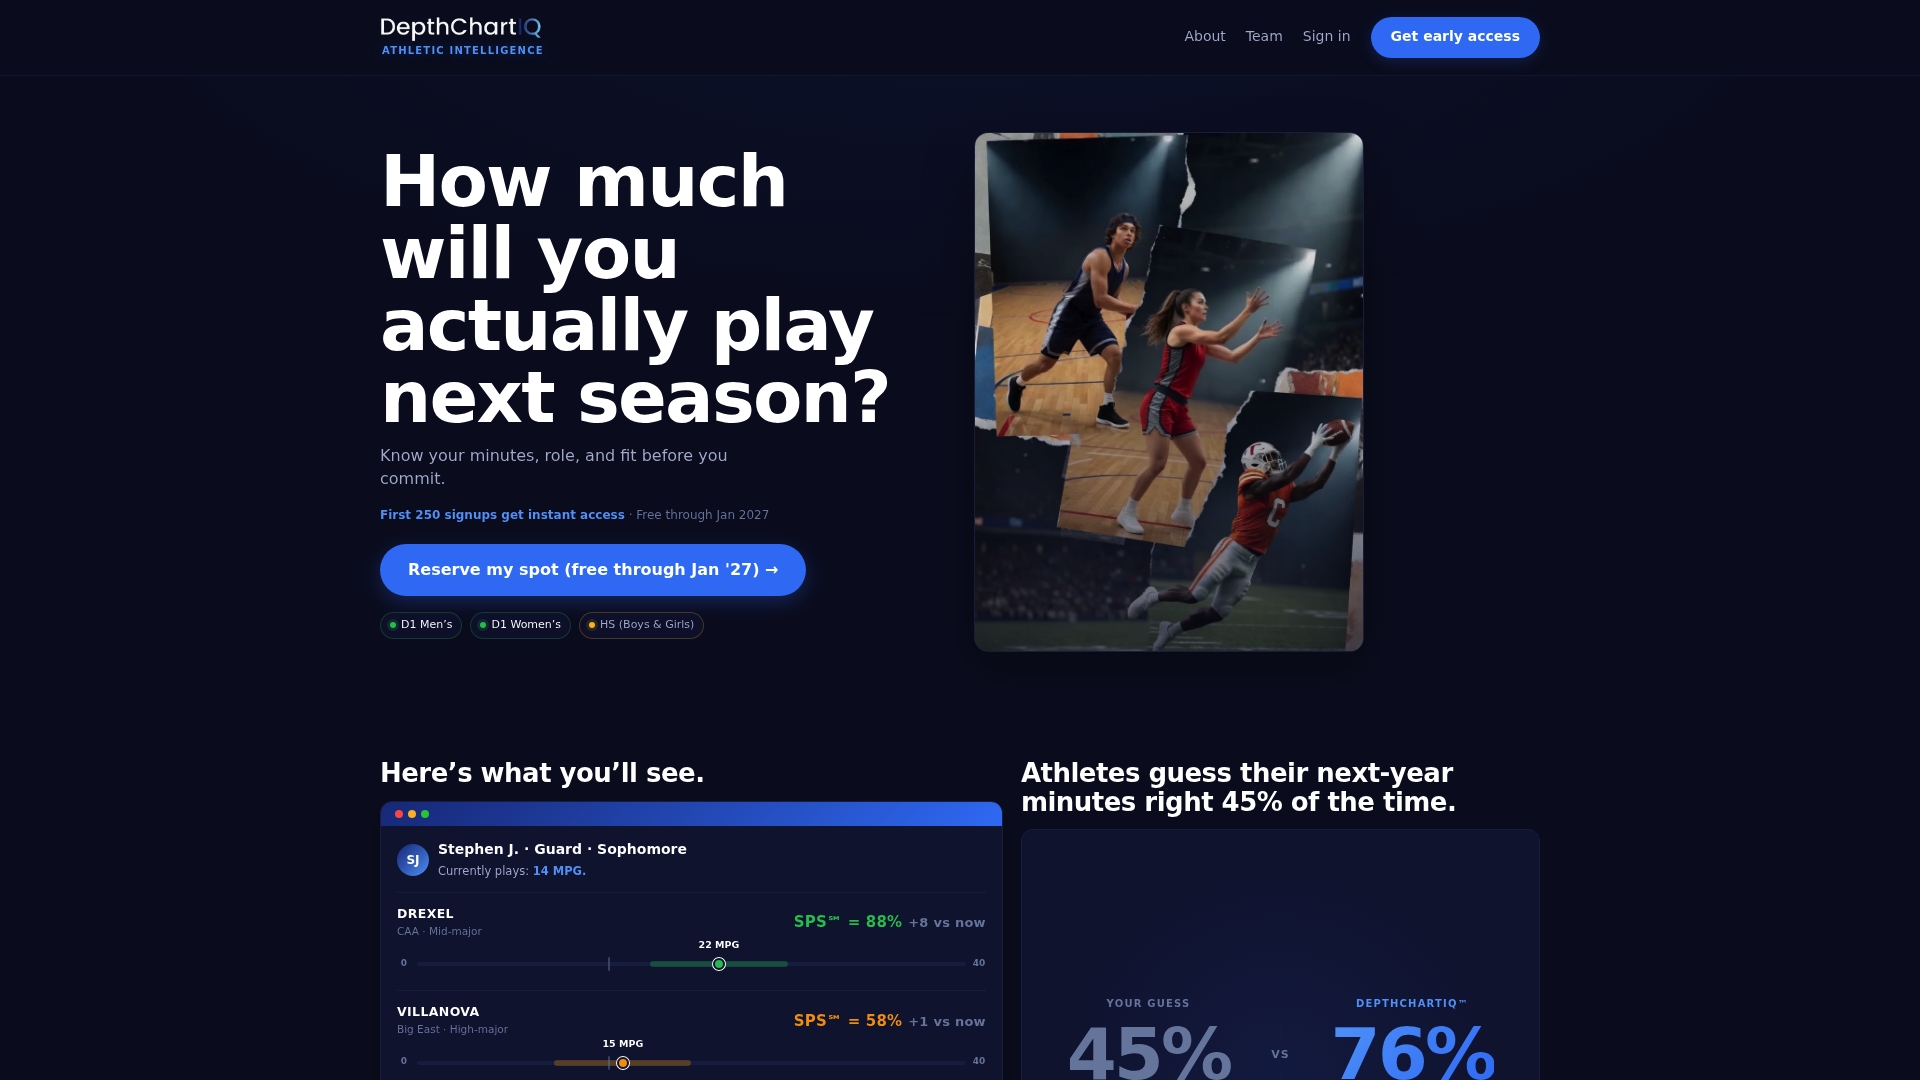
The platform’s Success Probability Scores and Roster Pressure insights are built specifically for athletes evaluating transfer options and recruits assessing program fit. DepthchartIQ reports a 76% accuracy rate in predicting player outcomes, which means the data behind your decisions carries real weight. Whether you are a coach tracking a prospect or an athlete deciding where to play next, the DepthchartIQ methodology gives you a framework grounded in the same analytics that programs use to build rosters. Visit DepthchartIQ to see how your benchmarks compare.
FAQ
What are the most important physical benchmarks for college basketball recruiting?
Height, wingspan, vertical leap, and lane agility are the primary physical benchmarks coaches use, with specific thresholds varying by position and division. Power 4 D1 guards typically need a vertical leap above 30 inches and a lane agility time under 10.8 seconds.
How do coaches use statistics to evaluate player development?
Coaches rely on tempo-free metrics like True Shooting Percentage, usage rate, and opponent-adjusted Offensive and Defensive Ratings rather than raw points per game. These metrics remove the distortion caused by pace and competition level to show genuine growth.
How many hours per week can NCAA teams practice?
NCAA rules limit teams to 20 hours of countable athletic activity per week during the season, with only 8 hours in the offseason and a maximum of 2 hours of on-court individual skill work. Most benchmark gains happen through independent training outside these limits.
What is a red flag turnover rate for transfer portal evaluation?
A turnover rate above 20% is a significant red flag for guards and typically worsens against tougher competition. Turnover habits reflect decision-making patterns that are difficult to change in a new program environment.
How much do players typically improve statistically over four years?
Most players show the steepest gains between freshman and sophomore seasons, with realistic targets including a 3–5 point TS% improvement and a 0.3–0.5 increase in assist-to-turnover ratio year over year. Physical gains like vertical leap improvements of 2–4 inches are achievable with consistent strength training through the sophomore year.