
Injury Return Projections for U.S. Fantasy: Use 0–14 Day Bins
Treat return dates as probability ranges. Learn the 0–7, 8–14, 15–28, 29–60, 60+ day bins, the key test signals, and a 3‑tier hold/stash/cut roster rule.
 DepthChartIQUpdated 16 min read

Treat every return date as a probability range, not a fixed day on a calendar. Clinical stage, objective test results, and model confidence together determine whether a player is more likely back in 0 to 7 days, 8 to 14, 15 to 28, 29 to 60, or beyond 60. Fantasy managers and sports staff who anchor decisions to those bins, rather than a single headline date, make better roster calls.
TL;DR:
- Injury recovery ranges depend on injury severity, with some like mild concussions and ankle sprains often resolving within a few weeks, while others like ACL reconstructions may take up to a year.
- Return timelines are influenced by clinical protocols, functional test results, and psychological readiness, not just fixed injury windows, meaning actual clearance can vary significantly between players.
- Mid-rehab test results, especially strength symmetry and hop-test performance, are key indicators that can help refine a player’s expected return time beyond general injury averages.
- Probabilistic models improve return date predictions by classifying athletes into time bins using clinical data, but their accuracy varies and they cannot reliably predict individual cases without context.
- Managers should base roster decisions on multi-factor updates such as rehab phase, test results, and psychological cues, with a focus on objective performance data rather than team estimates or media speculation.
DepthChartIQMake Smarter Roster DecisionsDepthChartIQ provides real-time roster insights, Success Probability Scores, and Roster Pressure data for athletes evaluating their next move.Explore DepthChartIQ
Table of Contents
- Typical Return Windows by Injury Type
- How Clinicians Actually Decide When to Clear an Athlete
- The Tests and Numbers That Actually Move a Projection
- What Probabilistic Models Add, and Where They Fall Short
- Turning Projections Into Roster Decisions
- How We Apply This at DepthChartIQ
- DepthChartIQ Pro Turns These Signals Into a Number You Can Act On
- Sources
- FAQ
Typical Return Windows by Injury Type
Every injury carries a range, and the width of that range says as much as the midpoint. A concussion with no complicating factors can often resolve within about one to two weeks. A high ankle sprain can vary widely in recovery time from a few weeks to several months. Knowing the baseline range for each injury type is the first input into any projection.
Concussion. CDC guidance describes a staged return with a minimum of 24 hours per step and a requirement to be symptom-free before advancing, which puts an uncomplicated case in the 7 to 14 day window for most athletes. Cases with persistent symptoms, a history of prior concussions, or slow progression through the steps push into the 15 to 28 day bin or longer. A prior concussion also raises the odds of a future injury of any kind, which matters for how conservatively a manager should treat a “cleared” player in the weeks after return, a point covered in more detail below.
Hamstring strain. Grade I strains (mild fiber disruption) typically return players in 1 to 3 weeks. Grade II strains, with partial tearing, generally run 3 to 6 weeks. Grade III strains, involving a complete or near-complete tear, can sideline an athlete for 8 weeks or more and occasionally require surgical repair. Factors that lengthen the window include reinjury (hamstrings are notoriously prone to it), involvement of the tendon rather than the muscle belly, and an athlete’s sport-specific sprint demands.
Ankle sprain. The range here is unusually wide because “ankle sprain” covers two different injuries. A lateral ankle sprain, the common rolled-ankle injury, often resolves in 1 to 3 weeks for mild grades and up to 6 weeks for severe grades. A syndesmosis or “high ankle” sprain, involving the ligaments that bind the tibia and fibula, routinely takes 6 to 12 weeks and can extend past that if there is any instability requiring surgical stabilization. Differentiating the two early is one of the highest-value pieces of information a manager can get from beat reporting or team statements.

Meniscus and ACL injuries. A meniscus tear managed conservatively (rest, bracing, physical therapy) can allow return in 4 to 8 weeks depending on tear location and whether it is in the blood-supplied outer zone. A meniscus repair typically pushes recovery to 3 to 6 months. ACL reconstruction is the clearest season-ending threshold in sports: the standard rehabilitation arc runs 9 to 12 months, with objective testing (covered in the next section) determining exactly where in that range a given athlete lands. Fantasy purposes generally treat any confirmed ACL tear as a full-season loss unless the injury occurs very early in a long calendar.
Shoulder injuries. Rotator cuff strains and mild impingement often clear in 2 to 6 weeks with rehab. A labral tear, particularly one requiring surgical repair, can keep an athlete out 4 to 6 months, longer for overhead-throwing athletes who need to rebuild rotational strength before contact clearance. Shoulder instability without surgery can sometimes return an athlete in 1 to 3 weeks with a brace, but the reinjury risk in that scenario is meaningfully higher than for other joints.
- Concussion: 7 to 28 days depending on symptom resolution and prior history.
- Hamstring strain: 1 to 8+ weeks by grade, with reinjury as the main risk to the timeline.
- Lateral ankle sprain: 1 to 6 weeks; syndesmosis sprain: 6 to 12+ weeks.
- Meniscus: 4 to 8 weeks conservative, 3 to 6 months post-repair.
- ACL reconstruction: 9 to 12 months as a standard planning range.
- Shoulder labral repair: 4 to 6 months, longer for throwing athletes.
Emerging regenerative options are also shifting some of these windows for certain soft-tissue and joint injuries, and the evidence on biologic therapies is worth a look for readers evaluating whether a specific athlete’s treatment plan might land on the faster or slower end of a given range.
How Clinicians Actually Decide When to Clear an Athlete
Return timelines are not just calendar math. They are the output of a staged clinical protocol, and understanding that protocol tells you why some players clear faster than the “typical” range and others stall inside it.
For concussion specifically, CDC guidance lays out a return-to-sports progression built on discrete steps: light aerobic activity, moderate activity, non-contact drills, full-contact practice, and finally competition. Each step requires a minimum of 24 hours, and an athlete can only move to the next step if they remain symptom-free at the current one. A single day of headache or dizziness during step three effectively resets the clock on that step, which is why two athletes with the “same” concussion can return four or five days apart.
For soft-tissue and post-surgical injuries, clearance follows a similar logic even without the CDC’s exact framework. A typical progression looks like this:
- Acute phase: control swelling and pain, protect the injured tissue, and restore basic range of motion.
- Early rehab: rebuild strength and mobility with progressively loaded exercises, often measured against the uninjured limb.
- Sport-specific rehab: reintroduce running, cutting, jumping, or throwing mechanics in a controlled setting.
- Return-to-training: full participation in non-contact or limited-contact practice.
- Return-to-competition: cleared for game action, sometimes with a minutes or snap-count restriction in the first appearance.
Clinicians use functional-test thresholds to decide when an athlete can move between these phases, most commonly a strength symmetry score (comparing the injured limb to the healthy one) and a hop-test performance benchmark, both discussed in more detail in the next section. An athlete who cannot clear those thresholds stays in rehab regardless of how many weeks have passed on the calendar, which is the single biggest reason media-reported timetables run optimistic compared with actual clearance dates.
Daily symptom checks and psychological readiness add another layer of delay that is easy to underestimate. An athlete who is physically capable of contact but reports lingering apprehension, particularly common after ACL reconstruction, may be held back a further one to two weeks while sports psychology or performance staff address that hesitation. The CDC’s clinical guidance for providers explicitly frames this as an individualized, team-based process rather than a fixed schedule, because healing rates and readiness genuinely vary between athletes with what looks like the identical diagnosis.
Pro Tip: When a team says a player is “week to week,” ask whether that estimate reflects a specific rehab phase or just a guess based on the injury type. The difference changes how much weight the timeline deserves.

The Tests and Numbers That Actually Move a Projection
Generic injury-type ranges get you in the right neighborhood.
For ACL reconstruction specifically, a randomized trial evaluating multidimensional predictors found that a six-factor model, combining strength limb symmetry index, hop-test performance, ACL-Return to Sport after Injury (ACL-RSI) psychological readiness scores, proprioception, and rehabilitation approach, showed strong discriminative ability for predicting successful return to play at 48 weeks when measured at the 24-week mark. The model’s apparent accuracy (AUC 0.87) held up reasonably well after correction for overfitting (bootstrap-corrected AUC 0.81), which means these mid-rehab numbers are genuinely informative, not just a formality clinicians check off.
- Single-leg hop tests measure explosive power and confidence in the injured limb compared with the healthy one; a low score at the midpoint of rehab is one of the clearer red flags for a delayed return.
- Isokinetic strength testing produces a limb symmetry index, and clinicians generally want the injured limb close to the uninjured one before clearing contact activity.
- ACL-RSI scores psychological readiness to return, and a low score can hold back an athlete who is physically ready but not mentally prepared for cutting and pivoting.
Athletes with elevated reinjury odds after concussion deserve a longer look before “return equals healthy” gets applied. A systematic review and meta-analysis pooling cohort studies found that athletes with a prior concussion have roughly 1.93 times the odds of any subsequent injury and roughly 3.06 times the odds of a repeat concussion, with the elevated risk sometimes persisting past six months. For fantasy purposes, that means clearance from concussion protocol is not the same as a clean bill of health for the rest of the season, and a manager holding a recently returned player should weigh that elevated risk rather than treating the return date as the end of the story.
If you have any access to team medical updates, beat reporters, or an athlete’s own public statements, the highest-value data points to request are: current rehab phase, most recent strength symmetry percentage if available, whether a hop test or equivalent functional test has been passed, and whether there is any mention of psychological readiness or hesitancy. Those four data points do more to narrow a projection than any amount of speculation about “gut feel” for a return date. Our guide to asking coaches the right questions about playing time breaks down how to phrase those requests to athletic staff or advisors.
What Probabilistic Models Add, and Where They Fall Short
Once you have the injury type and the available test results, a probabilistic model is the tool that converts those inputs into an actual time-to-return estimate, expressed as a probability rather than a single date.
One approach, a Bayesian network, integrates clinical variables (injury type, severity, prior history) with contextual ones (competition level, match schedule, anthropometric data) to classify an athlete’s days-to-return-to-sport into discrete bins. A study applying this method to football injury data reported sensitivity ranging from 0.24 to 0.97 across different return-time bins, with user accuracy ranging from 0.52 to 0.83. That spread is the key takeaway: the model does meaningfully better than a coin flip in most bins, but its reliability is uneven, better at classifying some return windows than others, and no single accuracy figure tells the whole story.
Machine learning approaches show a similar pattern of promise paired with caveats. A systematic review of ML methods for return-to-sport prediction found that algorithms such as Random Forest have produced strong performance figures (AUCs above 0.9) in some individual studies, but the review flagged substantial heterogeneity across studies in how “return to sport” was even defined, which features were used, and how models were built and validated. That heterogeneity is exactly why a single AUC number from one study should not be treated as a universal performance guarantee for any model applied to a different sport or injury type.
- Bayesian networks classify days-to-return into bins using both clinical and contextual variables, useful for probability-range projections rather than single-day predictions.
- Reported sensitivity and accuracy for these models vary widely by bin, so treat any single performance figure as a range, not a fixed guarantee.
- ML reviews note inconsistent definitions of “return to sport” across studies, which limits how confidently a result from one dataset transfers to another.
- The biggest blind spots in any model are psychological readiness and rehab adherence, neither of which shows up reliably in the injury and roster data feeding most systems.
The practical translation for a fantasy manager or team professional is straightforward: use model output to set a confidence level on a bin (for example, “likely in the 8 to 14 day range” versus “likely beyond 60 days”), then adjust that confidence up or down based on the clinical-stage and objective-test information covered in the previous two sections. A model probability without clinical context is a starting point, not a final answer, and the same is true in reverse.
Turning Projections Into Roster Decisions
All of this analysis is only useful if it changes what you actually do with a roster spot. A simple three-tier framework, mapped to the probability bins, keeps decisions consistent across a full season.
- 0 to 2 weeks likely: hold the player. If a model or clinical signal puts return probability above roughly 70% for the 0 to 14 day window, the value of an open roster spot rarely outweighs the cost of losing the player right before return.
- 3 to 6 weeks likely: stash if you have bench depth, otherwise consider a short-term replacement while monitoring weekly test updates for movement toward the 0 to 2 week bin.
- Beyond 6 weeks, or ACL/meniscus surgical repair confirmed: treat the roster spot as available for the rest of the relevant fantasy period, especially in shallower formats where bench space has real opportunity cost.
A practical scenario: a running back suffers a Grade II hamstring strain in week 3. The initial injury-type range puts him in the 3 to 6 week bin. By week 5, reporting indicates he has cleared a hop test and posted a strength symmetry score close to the healthy leg, information that should shift your internal probability toward the front of that range and justify holding rather than cutting. Without that update, a manager going purely off the original “3 to 6 weeks” estimate might drop him prematurely in a shallow league.
Before making the call, a short checklist helps: current rehab phase, most recent functional test result if reported, any mention of a setback or symptom recurrence, and whether the team’s own language suggests optimism or hedging. Beat reporters and team statements sometimes lean toward the optimistic end of a range, so weigh a clinician-sourced update more heavily than a coach’s public comment.
Pro Tip: When two sources disagree on a timeline, default to whichever one cites an objective test result rather than a general prediction.
How We Apply This at DepthChartIQ
We built DepthChartIQ around the same logic laid out above: real-time roster data, objective performance signals, and probabilistic modeling working together rather than any one input standing alone. Getting that balance right means being honest about tradeoffs. A conservative projection setting understates upside for players who beat their timeline; an aggressive one overstates confidence for players who do not. Neither is wrong, they serve different risk tolerances, which is why we surface probability ranges rather than single dates.
— John
DepthChartIQ Pro Turns These Signals Into a Number You Can Act On
Reading test results and model outputs across a full roster takes real time most managers do not have. DepthChartIQ Pro does that work continuously, converting the same categories of signal covered above into figures built for roster decisions.
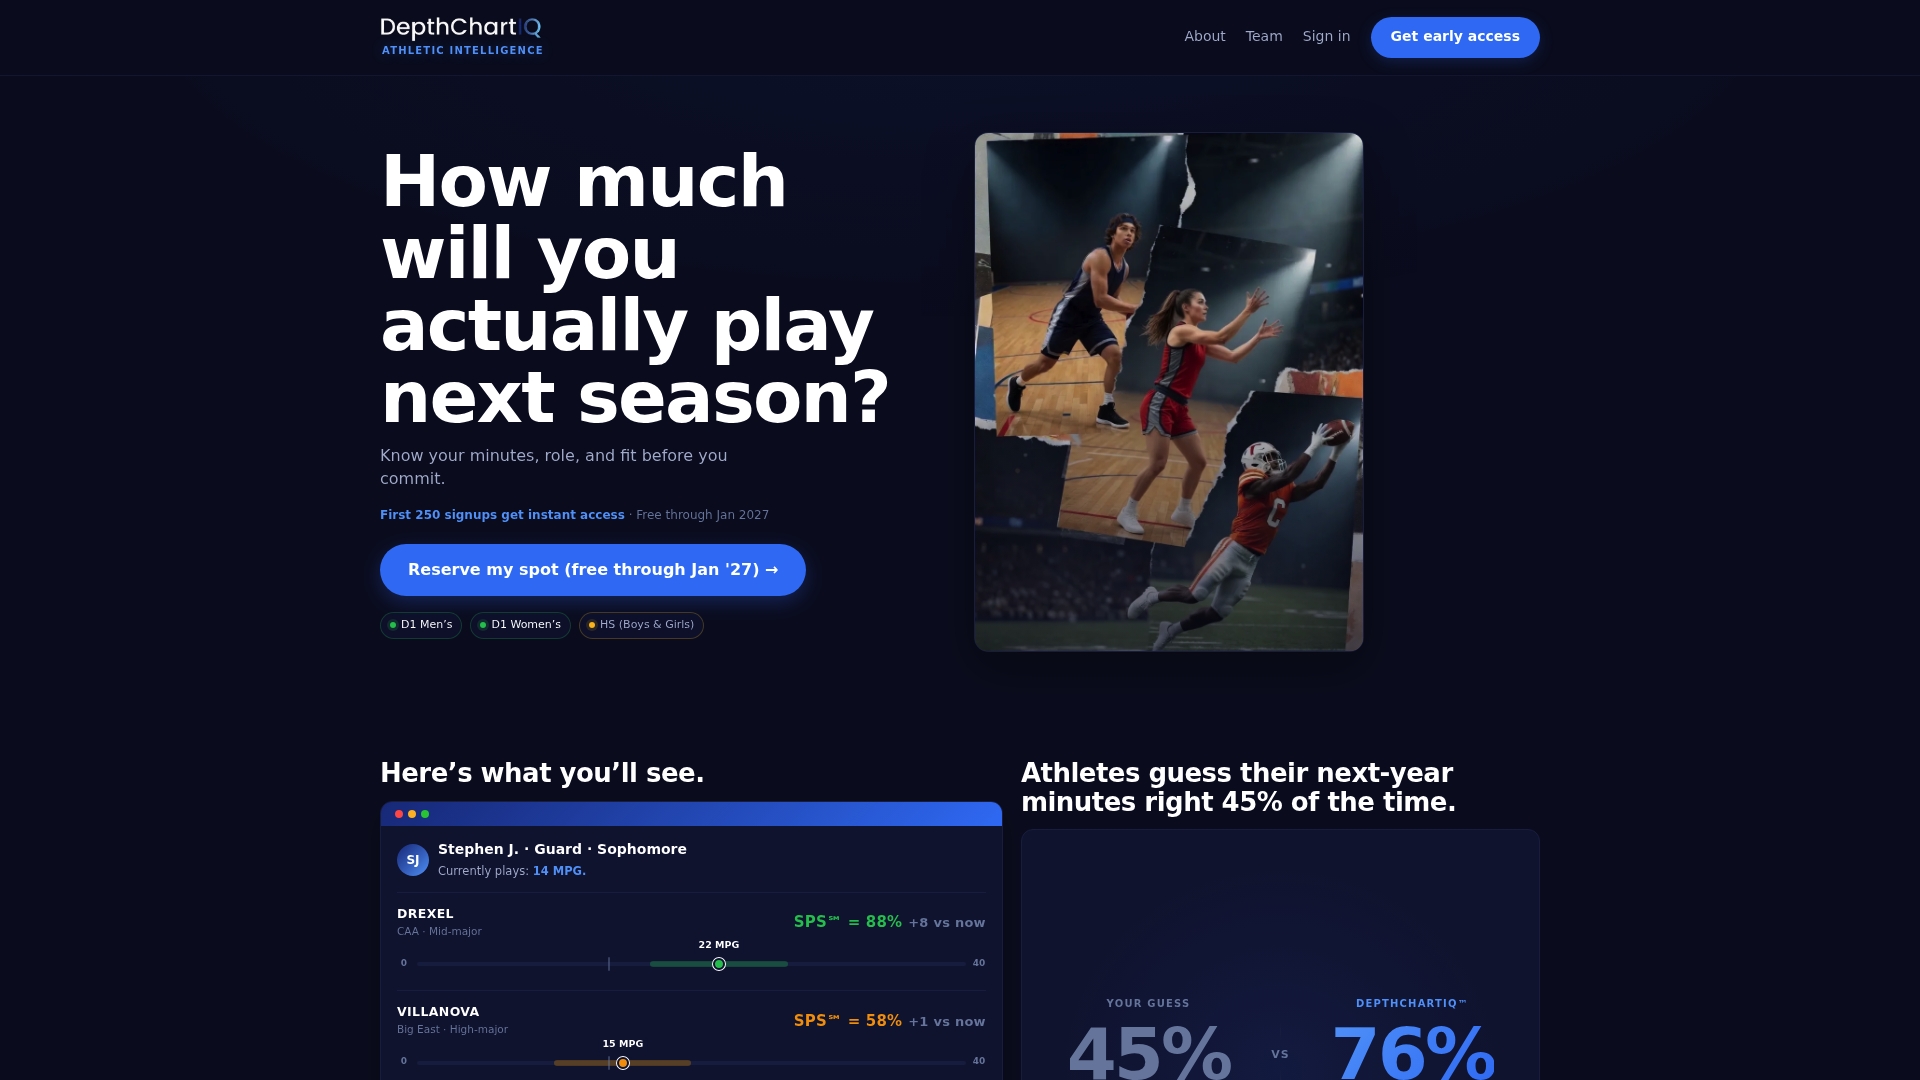
- Success Probability Score: a single figure summarizing an athlete’s likely path back to meaningful playing time.
- Predicted minutes per game: a projection of expected on-field production once a player returns.
- Roster pressure insights: how a returning player’s spot on the depth chart is shifting while they recover.
Those outputs map directly onto the hold, stash, or cut decisions covered earlier, translating clinical stage and model confidence into a single score instead of a pile of separate updates to track by hand. Visit Depthchartiq to see how DepthChartIQ Pro applies these signals to a specific roster.
This article is general information, not a substitute for advice from a qualified doctor. Consult a qualified healthcare professional about your own circumstances before acting on anything here.
Sources
- Returning to Sports | HEADS UP | CDC
- The risk of all-cause injury and site-specific injury in athletes after concussion: a systematic review and meta-analysis
- 24-week multidimensional predictors of return to play post-ACLR: a randomized trial
- Using a Bayesian network to classify time to return to sport based on football injury epidemiological data
FAQ
How accurate are injury return projections in general?
Accuracy varies widely by injury type, the objective test data available, and the specific model used. Bayesian network research on football return-to-sport data reported sensitivity ranging from 0.24 to 0.97 and user accuracy from 0.52 to 0.83 depending on the return-time bin, which is why any projection is best treated as a probability range rather than a guaranteed date.
What tests best predict when an athlete will return after ACL surgery?
Strength limb symmetry, single-leg hop-test performance, and ACL-RSI psychological readiness scores measured around the midpoint of rehab showed strong ability to predict successful return at 48 weeks in a randomized trial evaluating multidimensional ACLR predictors. These mid-rehab results are more informative than the injury type alone.
Why do team-reported timelines often differ from actual return dates?
Team and media timelines are frequently based on typical recovery windows for an injury type rather than an individual athlete’s actual test results and clinical stage. CDC clinical guidance notes that healing rates vary between individuals, and progression steps for injuries like concussion require symptom-free status before advancing, which can push a real clearance date later than an early public estimate.
Is a player more likely to get hurt again right after returning from a concussion?
Yes, research indicates elevated risk in the period after a concussion. A systematic review and meta-analysis found roughly 1.93 times higher odds of any subsequent injury and roughly 3.06 times higher odds of a repeat concussion, with risk sometimes persisting past six months, so a cleared player still carries above-average injury risk for a period after return.
How does DepthChartIQ estimate an athlete’s return-related playing time?
DepthChartIQ combines real-time roster data with probabilistic modeling to produce a Success Probability Score and predicted minutes per game for athletes tracked on the platform. Details on the underlying approach are available through DepthChartIQ Pro.